


- Bitcoin’s CME gap drives weekend volatility, which often recedes during traditional market reopening.
- BTC prices closely track global M2 expansions and signal macro-driven growth potential.
- Bitcoin is over $83,000 and has a $84,000 resistance amid a strong recovery from the $81,570 support zone.
Bitcoin (BTC) continues to show price movements that are closely aligned with institutional trading patterns and global financial expansion. Recent changes in the Crypto market highlight the gap in CME futures and the sensitivity of Bitcoin to the growing global M2 money supply, indicating the key factors that traders are monitoring future price directions.
Market data shows that Bitcoin formed a gap in CME (Chicago Mercantile Exchange) over the sixth consecutive weekend, reflecting a pattern of attracting attention among traders. Historically, Bitcoin prices remained relatively stable over the weekend, but recent activity has led to an increase in volatility and headline-driven movements over these periods.
As reported by Daan Crypto Trades, most of the weekend’s moves reversed the following week. This means that bitcoin rates will usually return on the day the CME opens, regardless of short-term volatility over the weekend.
$BTC has been doing the weekend gap for six consecutive weeks.
If prices weren’t doing much on the weekend, we’ve now seen a lot of volatility and headlines that can cause all sorts of price movements.
But what we saw was…every time there was a move between pic.twitter.com/d4eegqcnms
– Dan Crypto Trades (@dancrypto) April 12th
Bitcoin’s 15-minute candlestick trades within defined ranges, according to Binance Markets after the CME approaches. The red resistance zone above shows high intensity trading activity as prices reversed the CME gap below. The chart includes a magnet icon near the expected CME open, reflecting expectations that the price will be drawn to that level.
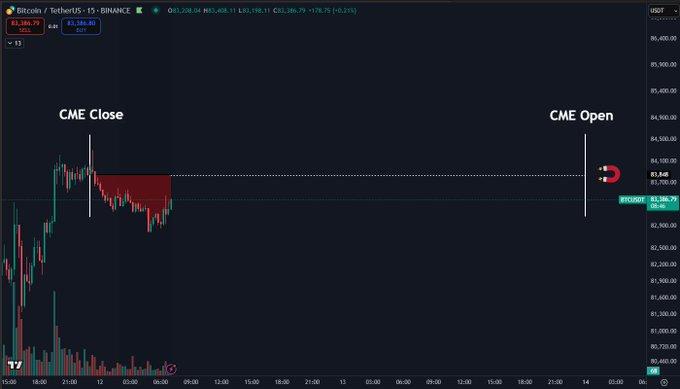
Source: x
This trading behavior points to the impact of institutional trading patterns on Bitcoin prices. The CME gap phenomenon has become the focus of market participants, indicating that price replenishment around these levels often indicates updated volatility or reversal.
Bitcoin is correlated with expansion of the global M2 money supply
In addition to CME-driven price actions, Bitcoin’s long-term actions are strongly correlated with increasing global liquidity. Recent comparison charts highlight the relationship between Bitcoin prices and global M2 money supply, which represent liquid assets such as cash, deposits and easily convertible financial products.
In the past, it has been revealed that Bitcoin tends to suffer from poor performance when there is an expansion in M2 when financial conditions are tight. However, this last chart shows that it has been increasing recently in the world M2. This shows the heart of the rise in Bitcoin prices.
In addition to this sentiment, Crypto analyst Bitbull noted that the bitcoin delay behind the growing money supply remains prominent. This observation adds to the market’s expectations that if Bitcoin follows a historical pattern of catching up to liquidity growth, a significant price movement (commonly referred to as the “God’s candle”) could occur.
Historically, $BTC has lagged behind expanding money supply. And now the gap is widening.
God’s candle may not be a “if” question, but when.
Good morning 🤞pic.twitter.com/uzuupstltwk
– Bitbull (@akabull_) April 12, 2025
Bitcoin prices exceed $83,000 amid the market recovery
As of the latest data, Bitcoin is trading at $83,633.18, reflecting a 2.48% increase over the last 24 hours. The market capitalization reaches $1.66 trillion, with circulating supply of 19.85 million btc of up to 2 million cases.
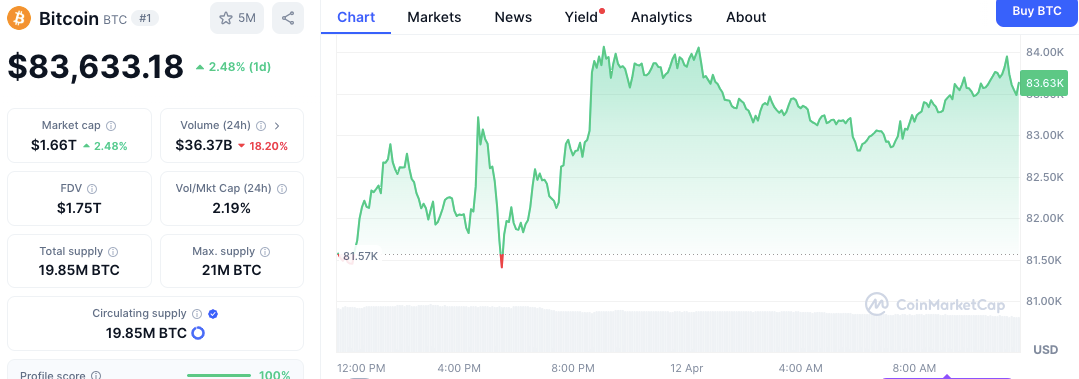
Source: CoinMarketCap
Prices have been rising recently, but trading volumes have fallen to $36.37 billion, down 18.20% from the previous period. Drawn under the early $82,000 mark, the daytime chart shows a sharp rise momentum in the second half of the chart, and is currently trading above $83,000.