


Bitcoin price has consolidated below previous range highs, and the development of a bear flag pattern suggests that downside risks remain elevated, with $80,000 emerging as a key support level.
summary
- Bitcoin lost its high range and turned to strong resistance.
- A bearish flag has formed near the midpoint of the range, suggesting continuation risks.
- $80,000 is a key downside support with static liquidity.
Bitcoin ($BTC) Recent price trends have been bearish as the market has consolidated below key resistance zones. After failing to keep the range high; $BTC experienced a sharp bearish extension to the downside and has since been trading near the midpoint of the broader range. Integration often creates uncertainty, and this structure of stagnation is causing concern.
From a technical perspective, Bitcoin appears to be forming a bear flag, a continuation pattern that resolves in the direction of the general trend. With downside liquidity still below, the current setup suggests that risks remain biased towards further declines.
Important technical points for Bitcoin price
- Lost range high and turned to resistance: The previous support capped any upside attempts.
- A bear flag forming near the midpoint of the range: A classic continuation pattern that favors downside resolution.
- $80,000 remains significant support: A break could trigger a liquidity-driven decline.
You may also like: Is Ethereum preparing to break above $4,000 as BitMine targets 5% supply rights?
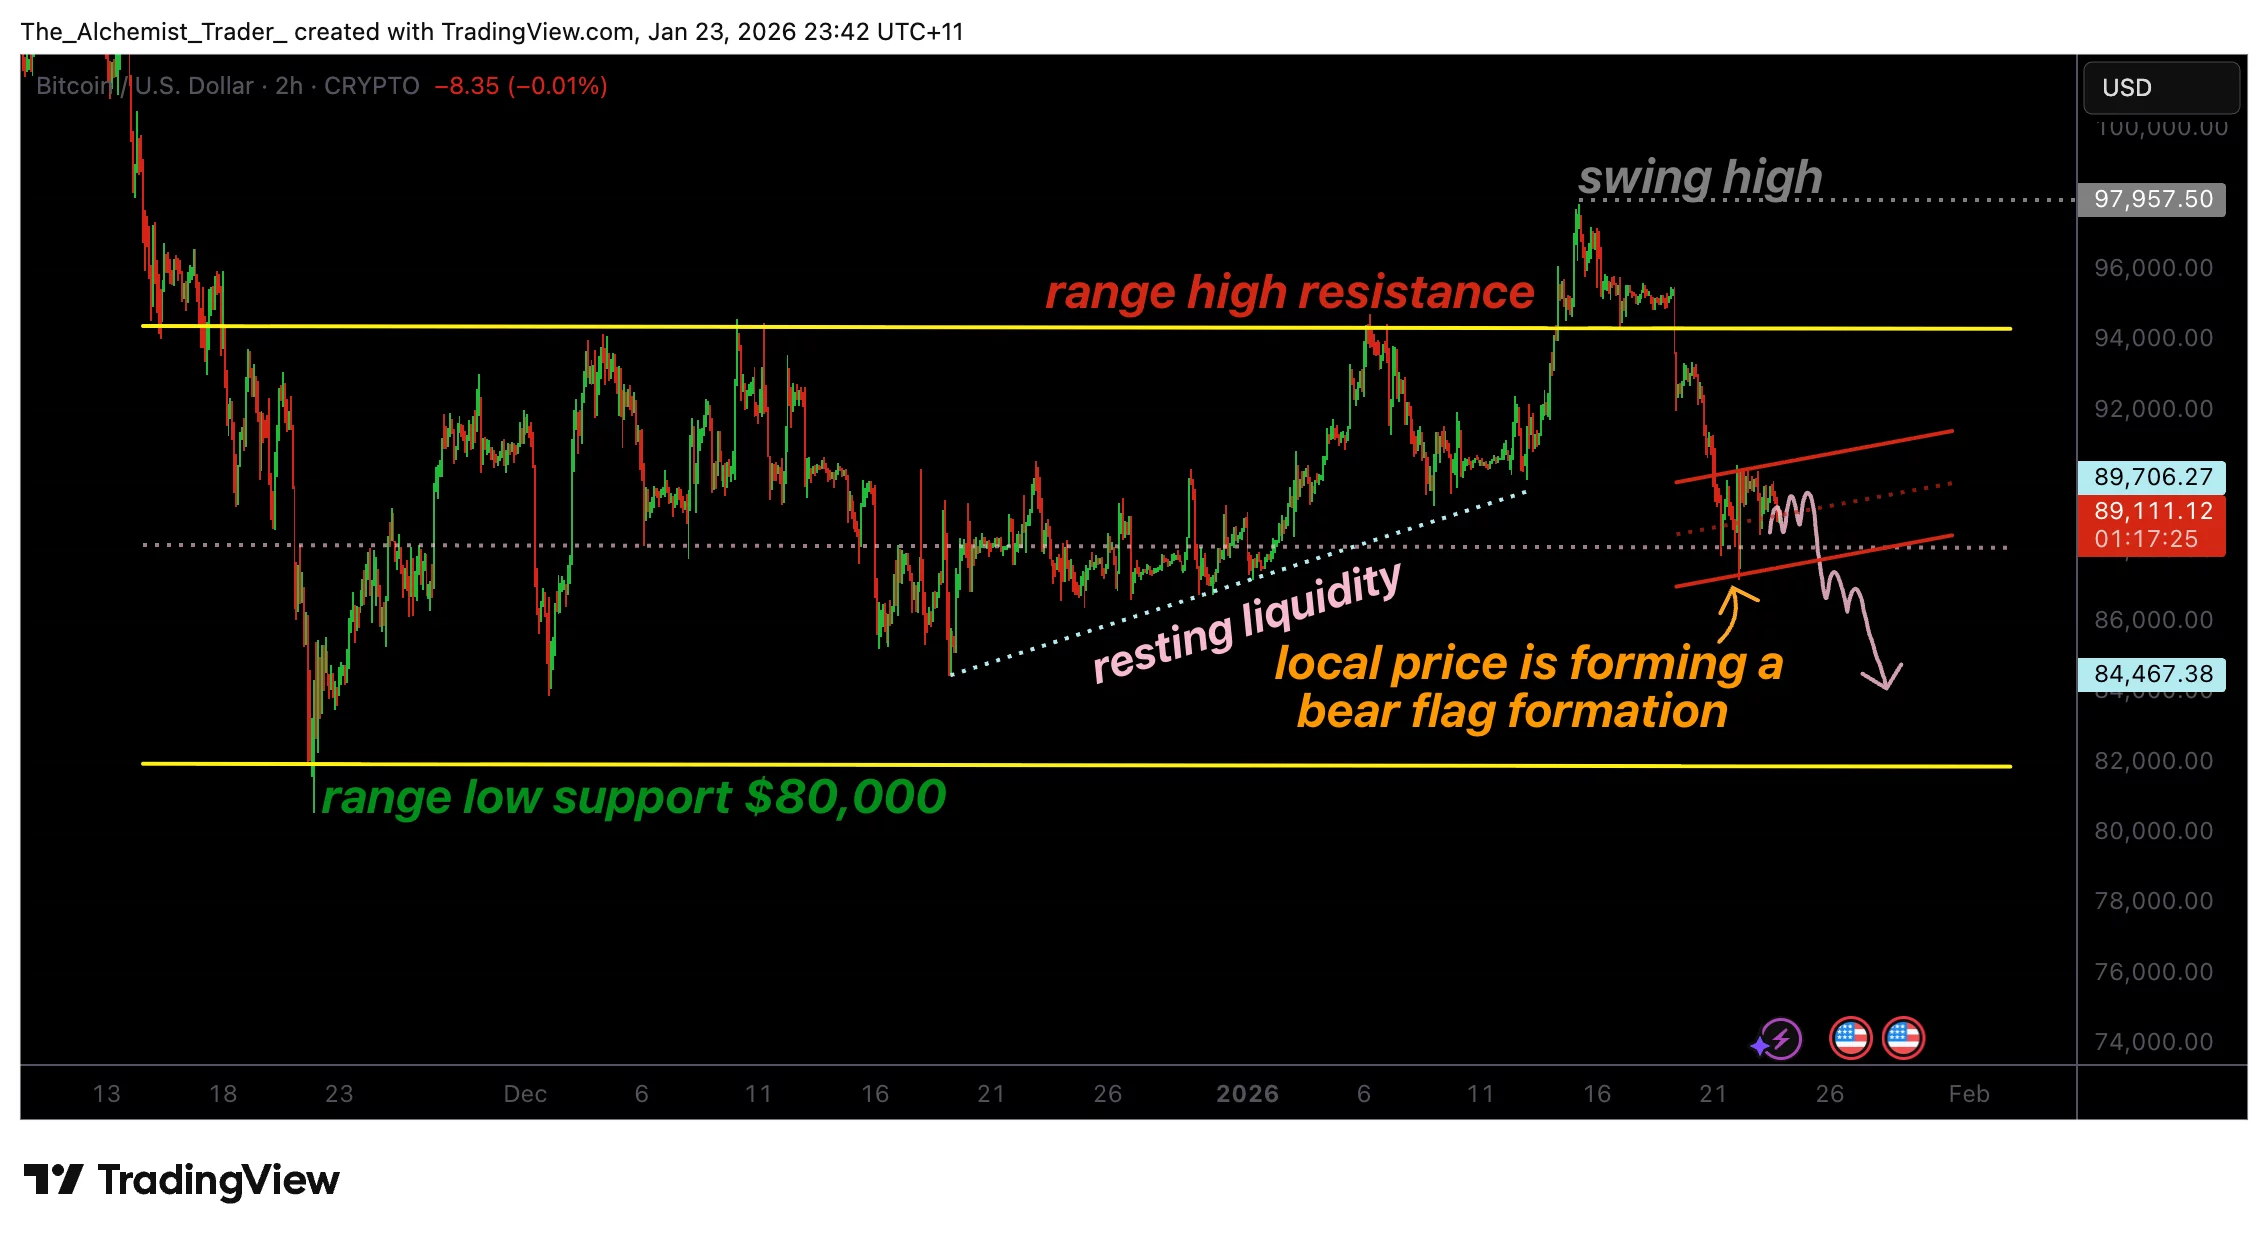
BTCUSDT (2H) chart, source: TradingView
The most important structural change in Bitcoin’s recent price trend is the loss of the range high that previously served as an important support level. If the price diverged beyond this level and was not accepted, sellers intervened aggressively, pushing down the bearish extension. This move changed the character of the market, shifting the bias from neutral to bearish.
Since then, the former’s range highs have acted as resistance, reinforcing the idea that any attempt to move higher is exposed to selling rather than support. This role reversal is a common feature in trending markets and often indicates that sellers are in control.
You may also like: Zcash price forms head and shoulders pattern as whale sells, eyes drop to $300
Consolidation takes on bearish characteristics
Following the downside impulse, Bitcoin entered a consolidation phase near the midpoint of the range. At first glance, this sideways movement can be interpreted as a return to balance in the market. However, the structure of the integration is important. Rather than forming a broad base or showing signs of accumulation, the price trend is compressed in a downward channel.
This structure is very similar to a bear flag, which is a bearish continuation pattern that forms after a sharp decline. A bear flag typically represents a pause where the market burns out losses before resuming the prevailing trend. The longer the price stays within this formation without regaining resistance, the more likely a downside break will occur.
Why is the bear flag important?
Bear flags are important because they reflect weakness in demand during consolidation. In a healthy reversal, buyers typically intervene aggressively, pushing prices up as volume expands. In this case, the Bitcoin consolidation lacks strong bullish follow-through. Volume is shrinking overall, and the upside is likely to remain shallow.
From a probabilistic perspective, bear flags tend to resolve in favor of sellers. Although these are not guaranteed outcomes, broader conditions, loss of range highs, bearish impulses, and lack of bullish strength add weight to bearish scenarios.
You may also like: Building an open AI infrastructure: Inside Gonka’s vision for distributed computing
$80,000 support and remaining liquidity
The next major level to look at is $80,000, which represents the support zone for the higher time frame. This area also contains static liquidity, so stop orders and unfilled bids may be concentrated there. Markets naturally gravitate toward such liquidity pools, especially when momentum aligns in that direction.
If the bear flag confirms on the downside break, a move towards $80,000 would be a logical target. Testing this level could rebalance the market and establish a more meaningful foundation. However, failure to hold onto $80,000 would expose Bitcoin to more serious downside risks and open the door to a broader correction.
Market structure remains bearish
From a market structure perspective, Bitcoin continues to make new highs below resistance levels, reinforcing the bearish bias. Until prices regain the previous range highs and show acceptance above, the rally is likely to be viewed as a correction rather than a trend change.
Patience is key in this context. Although the decline may last longer than expected, the technical framework suggests downside risks remain high as long as the bear-flag structure remains intact.
What to expect from future price trends
Bitcoin is currently at a critical inflection point. As long as price remains below the high of its previous range and remains solid within a bear flag structure, a downside continuation is likely. If the breakdown is confirmed, the $80,000 support level is likely to be targeted, where liquidity is concentrated, and buyers may try to protect the price.
To override the bearish setup, Bitcoin needs to break above the flag pattern and regain the resistance level on strong volume. Until that happens, the technical outlook remains cautious, with further downside risks firmly in focus.
read more: Building an open AI infrastructure: Inside Gonka’s vision for distributed computing