


Bitcoin price tried to start a new rally but failed at $89,250. BTC is currently consolidating below $89,000 and could react on the downside.
- Bitcoin has started a wave of recovery above the $86,800 zone.
- The price is trading above $87,000 and the 100 hourly simple moving average.
- On the hourly chart of the BTC/USD pair, a major ascending channel is forming with support at $87,650 (data feed from Kraken).
- If it stabilizes above the $89,500 zone, the pair could continue moving higher.
Bitcoin price faces resistance
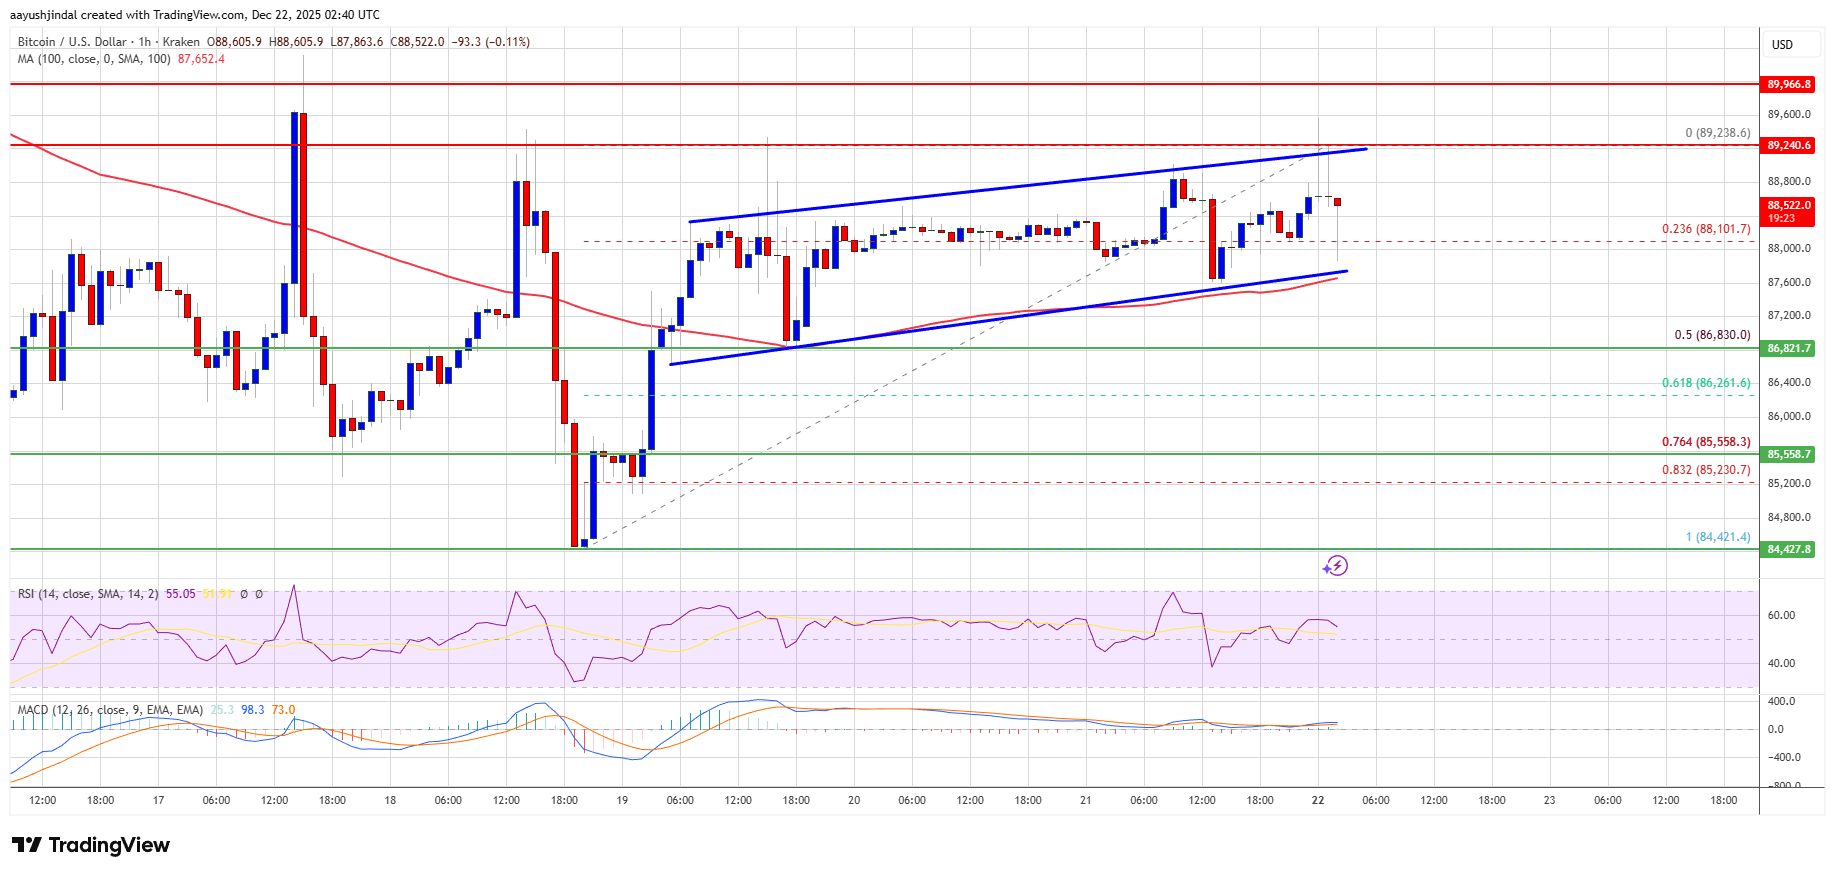
Bitcoin price attempted a new wave of recovery above $88,200 and $89,000. BTC tested the $89,250 resistance zone and struggled to continue higher.
Prices are currently consolidating gains below $89,000. There was a slight decline, testing the 23.6% Fib retracement level from the swing low of $84,421 to the high of $89,238. However, the bulls are active above $87,500.
Bitcoin is currently trading above $87,500 and its 100-hour simple moving average. There is also a significant uptrend channel forming with support at $87,650 on the hourly chart of the BTC/USD pair.
If the bulls continue their action, the price could try to move higher. Immediate resistance is near the $89,000 level. The first major resistance level is near the $89,250 level. The next resistance level could be at $89,500. If the price closes above the $89,500 resistance, the price could move higher. In the above case, the price could rise and test the $90,500 resistance. Any further rise could push the price closer to the $92,000 level. The next hurdles for the bulls could be $92,650 and $93,200.
Will BTC fall again?
If Bitcoin fails to rise above the $89,000 resistance zone, further decline could begin. Immediate support is near the $87,500 level. The first major support is near the $87,000 level.
The next support is currently located near the $86,800 zone and the 50% Fib retracement level of the swing low of $84,421 to high of $89,238. Any further losses could send the price towards the $85,500 support in the near term. The main support is at $84,400, below which BTC could accelerate its decline in the short term.
Technical indicators:
Hourly MACD – The MACD is currently losing pace in the bullish zone.
Hourly RSI (Relative Strength Index) – BTC/USD’s RSI is currently above the 50 level.
Major support level – $87,500 followed by $86,800.
Key resistance levels – $89,000 and $89,500.