

The price of Bitcoin (BTC) has been disrupted by international developments such as the Iran war, rising oil prices, the US Federal Reserve’s refusal to cut interest rates, and the full-scale expansion of the private credit crisis.
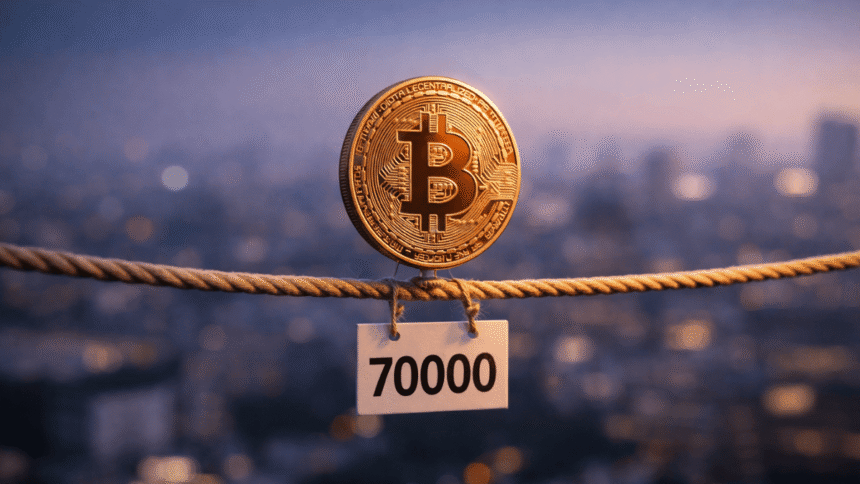
Despite all this, Bitcoin remains relatively strong around $70,000. As of this writing, it is trading at $69,500.
The following chart provided by CoinGecko shows how the digital currency has performed over the past seven days.
Amid this combination of Bitcoin strength and delicate environment, on-chain analytics firm Glassnode has detected that the market is exhibiting the following trends: There are some constructive signs, but “stronger participation is needed to make it more durable.”.
Accumulation zones and upper limits that are difficult for Bitcoin to pass
One of the core findings of the latest Glassnode report, published on March 25, 2026, concerns: Where recent Bitcoin purchases are concentrated.
According to the analysis of the so-called cost distribution, holder short term, New accumulation points are being formed in the range of $60,000 to $70,000. According to Glassnode, this buy zone is “modest in size, but sufficient to explain the recent bullish price momentum.”
Specifically, Glassnode is saying that the current price has seen an increase in Bitcoin purchases by investors who are not normally in a hurry to sell their Bitcoin.
However, the problem is as above. Between $93,000 and $97,000 there is a large concentration of Bitcoins purchased at that price. And today it is suffering losses.
Analysts here detail that these investors will have an incentive to sell and recoup their losses as soon as prices approach the cost of entry. Glassnode identifies these as “a group that could amplify selling pressure if prices attempt to recover their levels.”
There is strong fear, but no mass surrender (so far).
Another key metric in the report measures market-wide unrealized losses as a percentage of total capital. Simply put, it’s how much money is being lost by investors who haven’t sold yet. This figure has remained stable for two months at over 15% of market capitalization, an area Glassnode compares to the situation in Q2 2022, months before the collapse of Terra-Luna.
The company states that while this is “well below the extreme levels of surrender seen during acute stress events such as the FTX collapse, we characterize the current sentiment as one of heightened fear.”
In other words: There’s pain, but investors aren’t throwing in the towel en masse just yet.. This is both good news and bad news. There’s no panic, but there’s also no general euphoria that historically precedes the most powerful rebounds.
In terms of realized profits, the profits actually pocketed in fiat currency by those who sold at a profit, the outlook is more alarming. This metric has decreased by over 96% from a peak of approximately $3 billion per day in July 2025 to less than $100 million per day today.
For Glassnode, “this reduction in size is a typical feature of a bear market moving into its final stages, when the pool of profitable sellers is nearly exhausted.”
Bitcoin ETFs and derivatives give mixed signals
There is relatively encouraging news in the institutional market. Inflows into U.S. Bitcoin ETFs have turned positive in recent days after weeks of net outflows.
Glassnode described this as “an early sign that institutional demand may be starting to return,” warning that “a sustained return to positive territory would suggest that institutional buyers are regaining confidence.”
Still, the picture is still mixed, as you can see in the following image provided by CoinGlass. Red days (of net capital outflows) and green days (of net capital inflows) alternate.
But funding rates remain negative in the perpetual futures market, which Glassnode describes as “a favorite of short-term traders.”
This reflects the continued bearish bias in derivatives and means those betting on the downside are paying a premium to maintain their positions. In the case of glass nodes, This “suggests that confidence in the economic recovery remains limited, especially among leveraged traders.”.
Counterpoint: Willy Wu and the unfinished bear market
Glassnode’s analysis is not the most pessimistic going around in the market. As reported by CriptoNoticias, in mid-March, trader and analyst Willy Wu warned on his X account that the rally towards $75,000 could be a “bull trap”, a misleading strength signal that traps buyers ahead of another decline.
For Wu, the recent momentum has been driven primarily by short-term traders and the futures market, which he says has made liquidity “volatile and risky.”
His most dire diagnosis was: “Based on the liquidity situation that I see, we’re about a third of the way into the bear market.” If that’s true, Bitcoin will still have quite a bit of correction before it finds a solid structural bottom.
The features of Glassnode are not explained in detail. The report does not speak of an ongoing bear market, but rather a “rebalancing phase” with constructive signals that are not yet sufficient to speak of a bullish breakout.
The difference is not small. Woo plans further decline, Glassnode plans to level out with downside risk Unless new demand emerges.
Bitcoin bullish or bearish market without definition
Glassnode’s summary is accurate. “The structure clearly appears to be more constructive than bullish.”
According to Glassnode’s interpretation, the indicator shows: The worst of the selling panic is over, but the market is still waiting for missing material.: Sustained purchasing volumes and capital inflows that will thicken the recovery.
Until that happens, any recovery will be fragile and Wu’s warning will remain a hypothesis that the market cannot rule out.