


Despite the hot start to the month, the historically strong “Uptober” period has not particularly faded in line with expectations for Bitcoin price. Following the market-wide slump on October 10, the top cryptocurrency has failed to make a clear recovery to its previous highs.
In fact, Bitcoin price action continues to struggle amid ongoing bearish pressure, falling to a new low of around $103,000 on Friday, October 18. As uncertainty grips the markets, investors are wondering if the bull market is over or if the sluggish moves are just minor.
According to recent forecasts, the current technical position of BTC price may provide insight into what is next.
If BTC loses the $99,900 support, it risks a deeper correction.
In a post on social media platform The prominent cryptocurrency analysis firm has stated that the flagship cryptocurrency is currently between two major support zones.
This analysis is based on the Glassnode Technical Price Model, a chart that includes several technical indicators, including the Pi Cycle indicator, Mayer Multiple, annual moving average (MA), and 200-week moving average.
According to Glassnode, Bitcoin price is currently sandwiched between the Mayer Multiple ($107,400) and the Annual MA ($99,900).
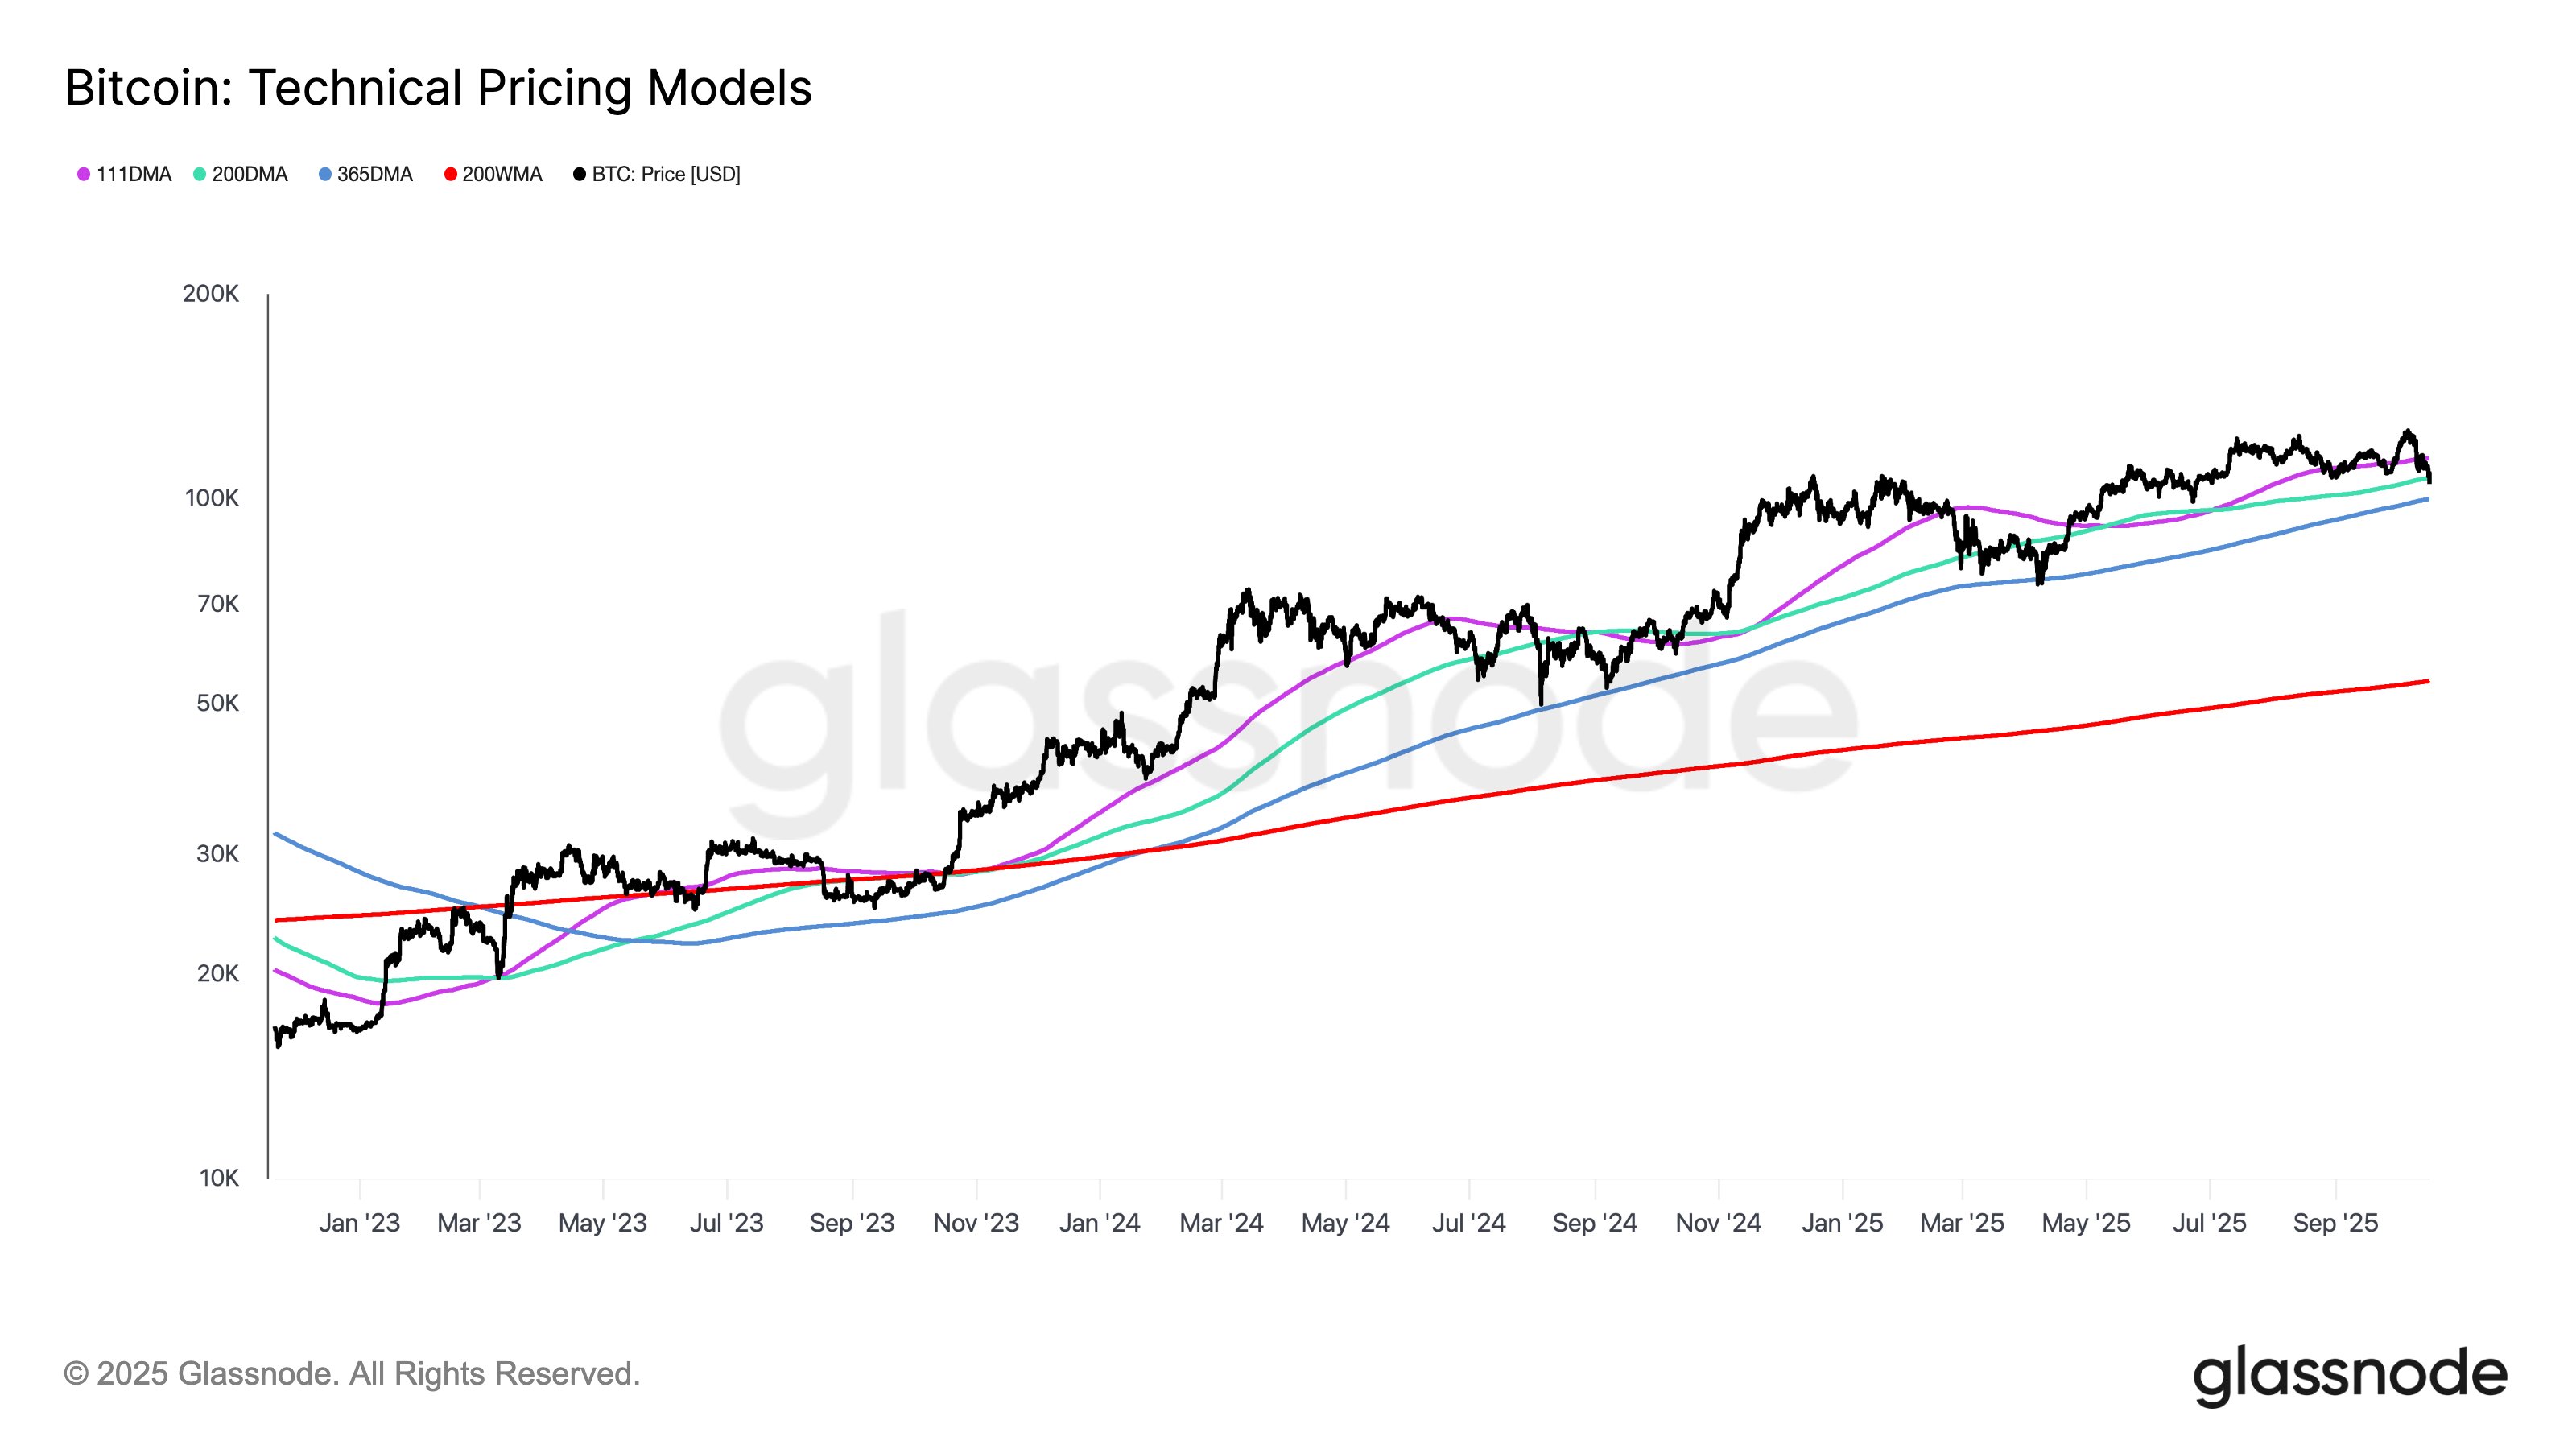
Source: @glassnode on X
The Mayer multiple (200-day simple moving average) is a popular technical indicator often associated with turning points between bull and bear markets. Meanwhile, the 365-day SMA provides a long-standing benchmark for high-term market momentum.
After the recent downturn, Bitcoin price fell below the 200-day moving average, suggesting a possible transition from a bull market to a bear market. BTC still remains above its 365-day MA, but the top cryptocurrency needs to remain above this level to stabilize the current trend.
Ultimately, investors may want to keep an eye on the BTC price. That’s because a drop below the $99,900 level could spell even bigger trouble for the world’s largest cryptocurrency. It is worth noting that although there is price resistance around the 111-day moving average (currently $114,700), a return above the Mayer Multiple could be important for Bitcoin’s development.
Bitcoin price at a glance
As of this writing, the value of Bitcoin is approximately $106,427, reflecting a price decline of nearly 2% over the past 24 hours.
The price of BTC on the daily timeframe | Source: BTCUSDT chart on TradingView
Featured image from iStock, chart from TradingView
editing process for focuses on providing thoroughly researched, accurate, and unbiased content. We adhere to strict sourcing standards and each page undergoes diligent review by our team of top technology experts and seasoned editors. This process ensures the integrity, relevance, and value of the content for readers.