


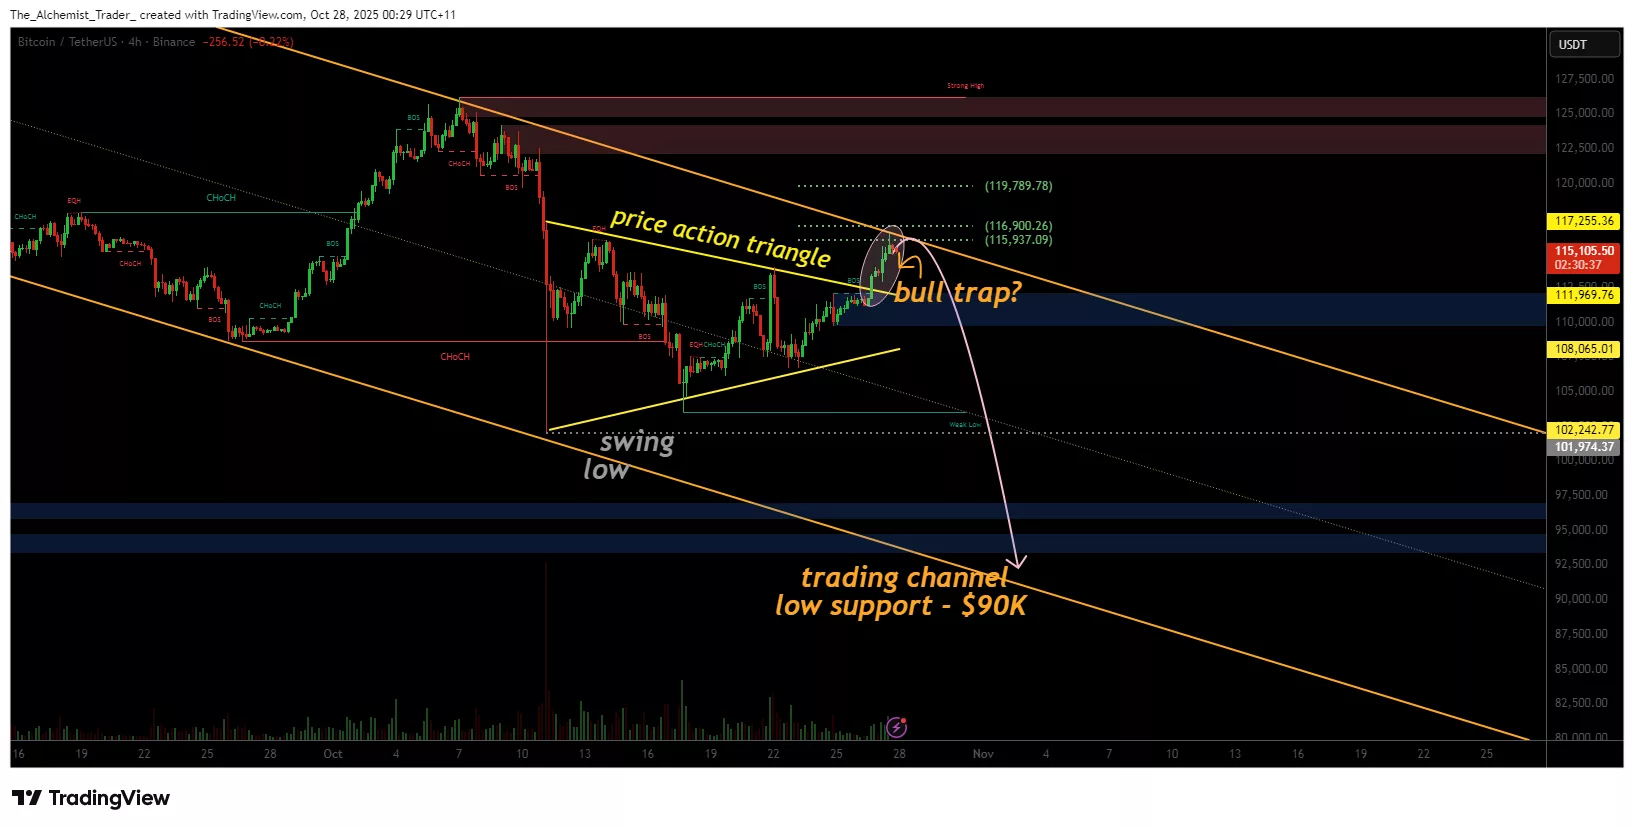
Bitcoin price has broken out of the local triangle pattern and is rebounding towards $115,000, but this move is facing significant resistance at the channel high where a potential bull trap could emerge.
summary
- Bitcoin breaks out of local triangle consolidation with bullish momentum.
- The $115,000 channel high serves as a major resistance and potential bull trap zone.
- If the breakout is confirmed, we are targeting $125,000-130,000, but if it is rejected, we risk a retrace to $90,000.
Bitcoin (BTC) price has successfully broken out of a local triangle pattern, confirming short-term bullish momentum as the price surges towards the channel resistance at $115,000. This breakout signals a significant technical development following weeks of price action in a narrow range.
However, while this move confirms a bullish continuation pattern, the $115,000 resistance zone remains a key inflection point and a bullish trap could form if the price fails to sustain above it.
bitcoin price Important technical points:
- Triangle breakout: Bitcoin broke out of a local ascending triangle, confirming near-term bullish strength.
- Main resistance: $115,000 is the current upper limit for the trading channel.
- Bull trap risks: A rejection at $115,000 could cause a false breakout and rotation to $90,000.
You may also like: Top 3 altcoins poised to soar as SSR Oscillator hits cycle lows
BTCUSDT (4H) chart, source: TradingView
Bitcoin’s triangle breakout has injected new bullish energy into the market, pushing the price towards the current channel high $115,000 resistance zone. The breakout came after weeks of tense consolidation, with volatility compressed within a well-defined triangle. This upward break signals renewed buying interest, but this move is now facing a decisive test due to significant resistance.
The $115,000 level is a psychological and structural barrier and serves as the apex of Bitcoin’s upward trading channel. Historically, expansion into this region has resulted in temporary slowdowns and corrections, especially when accompanied by a decline in trading volumes.
If Bitcoin is unable to close above this level with any momentum, it could form a bullish trap and catch lagging buyers before falling towards the $102,000 and $90,000 support zones. Volume confirmation remains important, and a breakout above $115,000 with low or flat volume could signal a lack of conviction and increase the risk of a trap scenario.
You may also like: Ripple USD reaches $900 million milestone, XRP price is on a roll
Conversely, if Bitcoin breaks through the resistance and rises above with strong volume expansion, it could invalidate the bullish trap and open the way for a rally towards $125,000-$130,000.
If there is a rejection at $115,000, Bitcoin could move back toward midrange levels before regaining momentum. This maintains the broader bullish structure while flushing out overextended positions, a common feature of bull traps during strong uptrends.
What to expect from future price trends
If Bitcoin maintains the momentum of the triangle breakout and decisively moves above $115,000, the move could accelerate towards $125,000-$130,000, confirming the continuation of the macro uptrend. However, if this level cannot be sustained, a bullish trap could be triggered and the price could fall from $102,000 to $90,000 before attempting to move higher.
read more: WazirX News: Indian court freezes XRP redistribution following $230 million hack