


Morgan Stanley is inching closer to launching the first spot Bitcoin ETF issued by a major U.S. bank. It’s a move that highlights just how far cryptocurrencies have moved since their early days.
The bank recently received official NYSE listing notification for its fund MSBT. Analysts say this step is usually a sign that a debut is near.
Wall Street’s Deepening Embrace
This development comes alongside new data from Charles Schwab that shows Bitcoin’s price fluctuations have declined sharply over the past four years.
Bitcoin’s historical volatility hit 42% in 2025, according to the company’s analysis. That’s roughly half of what was recorded in 2021. For context, Tesla’s historical volatility reached 63% in the same year.
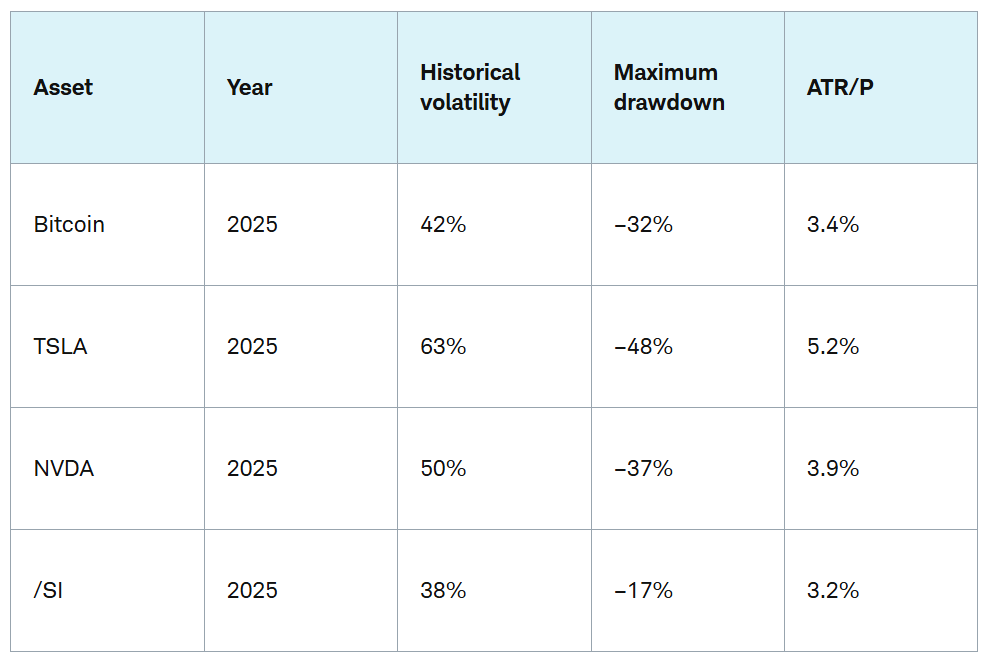
The table shows Bitcoin’s volatility fell below Nvidia (50) and Tesla (63) in 2025, and came close to silver futures at 38, which still saw notable swings. Source: Charles Schwab
NVIDIA had 50%. Both exceeded Bitcoin. Measures of daily price movements tell a similar story, with Bitcoin tracking closer to major stocks than the volatile peripheral assets it once was.
Schwab concluded that these changes reflect Bitcoin’s deeper integration into mainstream finance, with it now being traded on major exchanges around the world through regulated products and ETF wrappers. The report explained that Bitcoin’s volatility has “calmed down” as it matures.
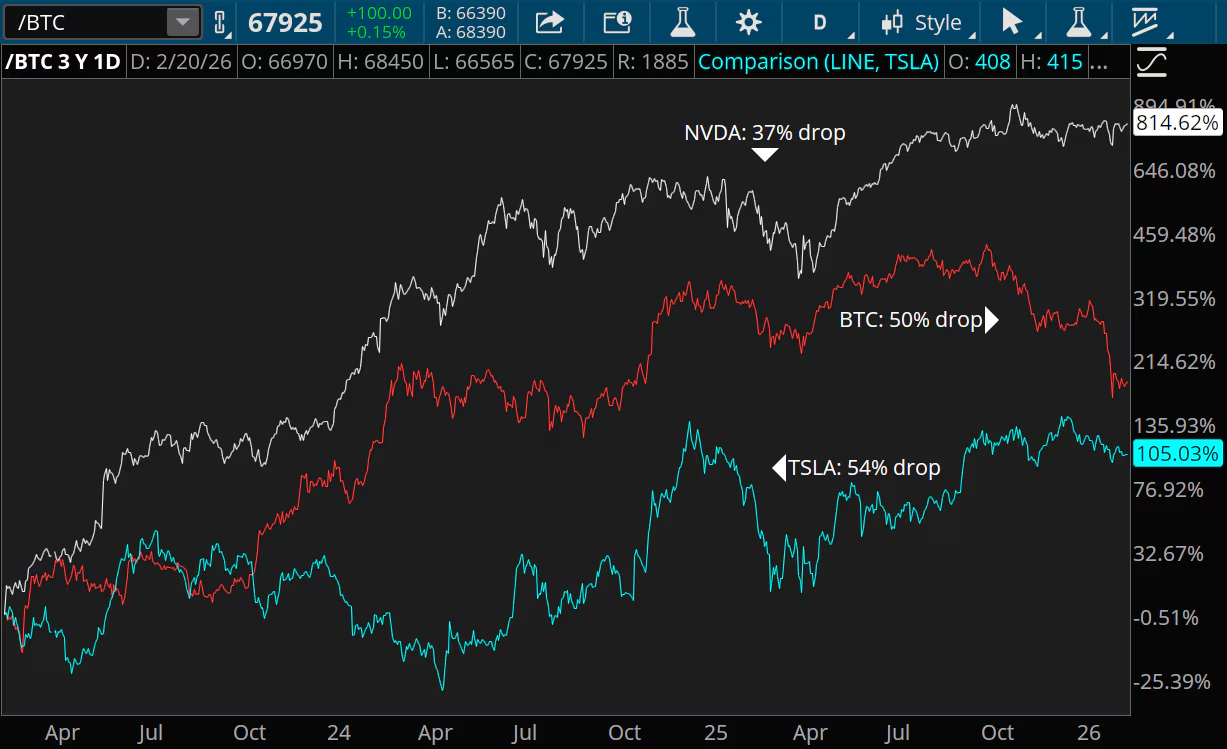
Still, tranquility is relative. Bitcoin fell as much as 30% in 2025, with losses extending into early 2026. In three years, assets fell 50% from peak to trough.
These numbers are important in almost every measurement, but they are not unique. Tesla’s worst decline during the same period was 54%. Nvidia is down 37% from its low point. The data suggests that high-growth tech stocks could swing as hard as Bitcoin, or even harder, in bad times.
A long-term perspective tells a different story
Zooming out further, Bitcoin’s profile becomes even more extreme. During the 2022 market downturn, Bitcoin fell 77% from its peak. Tesla fell 74%. NVIDIA lost 66%. Losses are steep across the board, but steeper for Bitcoin.
Schwab also compared Bitcoin to commodities. Silver futures often move more erratically on a day-to-day basis, despite recording smaller overall declines.
In contrast, gold has shown a steady rise from low volatility. This is a clear reminder that Bitcoin, regardless of its trajectory, still operates on a different risk scale than traditional safe-haven assets.
Bitcoin’s relative stability has become more prominent within the cryptocurrency market. Ethereum continues to trade with higher volatility and deeper declines, and the gap between the two assets has widened further since 2021.
Benchmark changes are underway.
The Schwab report was released as Bitcoin is increasingly measured against blue-chip stocks rather than speculative assets. Whether the framing stick may change depending on how the asset performs through the next major market stress test is a question the data cannot yet answer.
Featured image from Unsplash, chart from TradingView
editing process for focuses on providing thoroughly researched, accurate, and unbiased content. We adhere to strict sourcing standards and each page undergoes diligent review by our team of top technology experts and seasoned editors. This process ensures the integrity, relevance, and value of the content for readers.