


Important points
- $BTC The stock fell 2%, negating the recovery earlier this week.
- The U.S.-listed spot ETF recorded outflows of $173.73 million on Wednesday, marking its second day of inflows this week.
Bitcoin faces continued losses due to weak institutional demand
Bitcoin ($BTC) Prices continued to fall on Thursday, trading below $67,000, almost completely erasing the recovery from earlier in the week. Institutional demand also appears to be weak, with spot exchange-traded funds (ETFs) experiencing significant outflows of more than $173 million on Wednesday, halting inflows for the second day in a row.
This decline in demand coincides with growing bearish sentiment in the market, which was further amplified by US President Donald Trump’s recent comments suggesting an escalation of the ongoing conflict.
On Wednesday, President Trump addressed the nation and warned that the ongoing conflict could drag on until late April. He said the United States would take extreme measures over the next two to three weeks, including threatening to attack Iranian power plants and return Iran to the “Stone Age” if a deal is not reached.
These statements have dampened hopes that the situation will subside, and as a result, investors’ appetite for riskier assets has also waned. As a result, the U.S. dollar (USD) and oil prices rose while U.S. stocks and other risk assets fell, effectively erasing Bitcoin’s gains seen earlier this week.
data from coin glass This shows that institutional interest in Bitcoin remains uncertain. The Spot Bitcoin ETF recorded significant outflows of $173.73 million on Wednesday, following two days of positive inflows earlier this week. This suggests indecision among institutional investors, who appear reluctant to increase their exposure to risky assets amid continued market uncertainty.
According to Glassnode’s Wednesday weekly report, Bitcoin remains trapped within a wide trading range of $60,000 to $70,000. The market is showing early signs of stabilization, but has not yet shown enough momentum to break out decisively in either direction.
The report shows that Bitcoin’s on-chain situation reflects the continuation of the repair period, with increasing supply losses and capitulation of long-term holders still not fully resolved. However, spot demand has shown some improvement, indicating that sellers are no longer fully in control of the market.
Bitcoin price prediction: $BTC Further losses may be recorded.
of $BTCThe 4-hour chart of /USD is bearish and efficient as Bitcoin trades below $66,400 on Thursday, erasing the recovery from earlier this week. The short-term bias is slightly bearish.
bitcoin rThe remaining upper bounds are well below the 50-day, 100-day, and 200-day exponential moving averages (EMAs) between approximately $70,800 and $84,800, increasing downside pressure despite recent attempts at a rebound.
Technical indicators are currently bearish. The relative strength index (RSI) for H4 is 51, just above the midline.
The Moving Average Convergence Divergence (MACD) remains below the signal line, indicating sustained selling pressure.
If the market continues to decline, sellers will receive immediate support at $65,900. A breakout of this level will bring the key psychological level to $60,000.
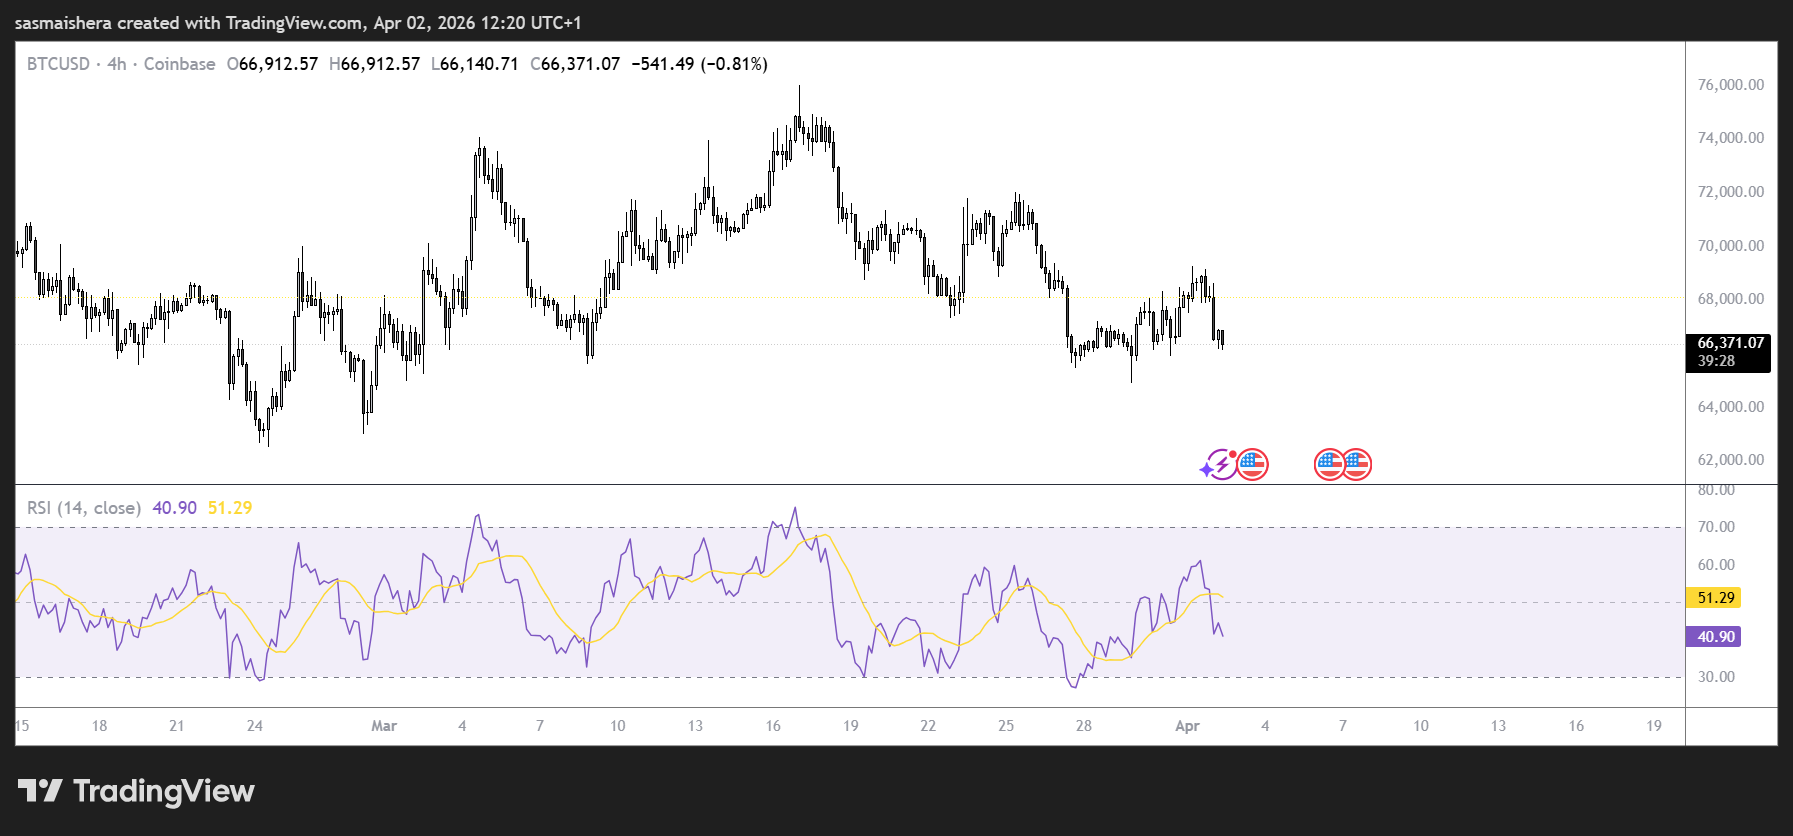
On the other hand, if the bulls regain control of the market, they will encounter resistance at the $69,200 level, with the main resistance around the $72,600 level.
A close of the day above $72,600 would signal a bullish break from the sideways structure and open the door to the 100-day EMA near $76,400.