


Analysts tracking post-halving activity say Bitcoin could approach the next big market bottom in late May 2026 if historical cycle patterns continue.
This outlook comes from JA Maartun, community analyst at blockchain data company CryptoQuant. Writing for X, he noted that it has now been 703 days since Bitcoin’s most recent halving. In previous cycles, the market bottom started forming around day 777. If that pattern holds, Maartun estimates a potential bottom is about two months from now.
Important points
- Analysts at CryptoQuant predict that the Bitcoin market bottom could be in late May 2026, based on the timing of previous halving cycles.
- Bitcoin is currently 703 days removed from its April 2024 halving, but the bottom of the past cycle started forming around day 777.
- The current cycle peaked at $126,080 in October 2025, followed by a correction of over 50%.
- On-chain indicators remain bearish, suggesting that the capitulation may be incomplete.
- The realized price model suggests that $55,000 is likely the final bottom of the bear market.
- The correlation between Bitcoin and gold has fallen to an all-time high of -0.9, a level that has historically been associated with market bottoms.
Halving cycles provide an anchor for the timeline
To understand this prediction, it is helpful to examine how the halving cycle works. The Bitcoin halving will reduce mining rewards by 50%, limiting new supply and reinforcing the scarcity of the asset. As a result, many investors see them as a long-term bullish catalyst.
The latest halving took place on April 20, 2024, reducing block rewards from 6.25. $BTC up to 3.125 $BTC. The next halving is expected to occur around March or April 2028, after another 210,000 blocks have been mined, and the reward is expected to drop to 1.5625. $BTC. These supply shocks typically occur every four years.
Historically, price movements follow a recognizable rhythm. Strong bull markets often occur 6 to 12 months after the halving, and bull market peaks tend to occur within 12 to 18 months.
The current economic cycle has broken historical patterns.
However, the ongoing cycle had unusual timing. Bitcoin rose to $73,777 in March 2024, before the halving, marking its first all-time high before the halving. Market observers believe the initial breakout was mainly due to demand from US spot Bitcoin ETFs.
Despite its anomalies, the cycle structure remained intact. Consistent with previous cycles, the post-halving rally continued, and the four-year expansion phase culminated in October 2025, when Bitcoin hit a new all-time high of $126,080.
Cycle Timing Insights ⏳
It has now been 703 days since Bitcoin’s halving.
In previous cycles, the bottom started around day 777. This is about 2 months from now. pic.twitter.com/ArYKmZKfsN
— Maartunn (@JA_Maartun) March 23, 2026
Market correction after peak
Immediately after the peak, the momentum reversed sharply. Bitcoin lost more than half of its value during the recession. This decline pushed the price up to nearly $60,000 in February 2026, a cycle low.
Prices have since stabilized but are still well below their peak. At the time of reporting, Bitcoin was trading at $70,296. This level is still 44.3% below the all-time high.
Such setbacks have been typical in past cycles. Historically, the deepest correction occurs about 30 months after the half-life and about a year after the cycle peak. Within that framework, Martun argues that if the four-year structure remains intact, a decisive bottom could form in late May 2026.
On-chain signals suggest further downside risk
Beyond price action, blockchain analysis provides further context. CryptoQuant reported last month that Bitcoin has not yet reached full capitulation and on-chain indicators are still in a bearish phase. In previous cycles, significant lows were formed only after the indicator entered an extreme bearish phase.
The firm also highlighted real price support levels, identifying $55,000 as likely the “ultimate” bear market lower bound. That threshold has not yet been tested, and CryptoQuant noted that developing such a base-building process typically takes time.
Bitcoin-gold correlation shows rare divergence
Meanwhile, asset-to-asset data shows changes in market dynamics. Michael van de Poppe, founder and chief investment officer of MN Capital, investigated the relationship between Bitcoin and gold and found that the correlation has fallen to record lows.
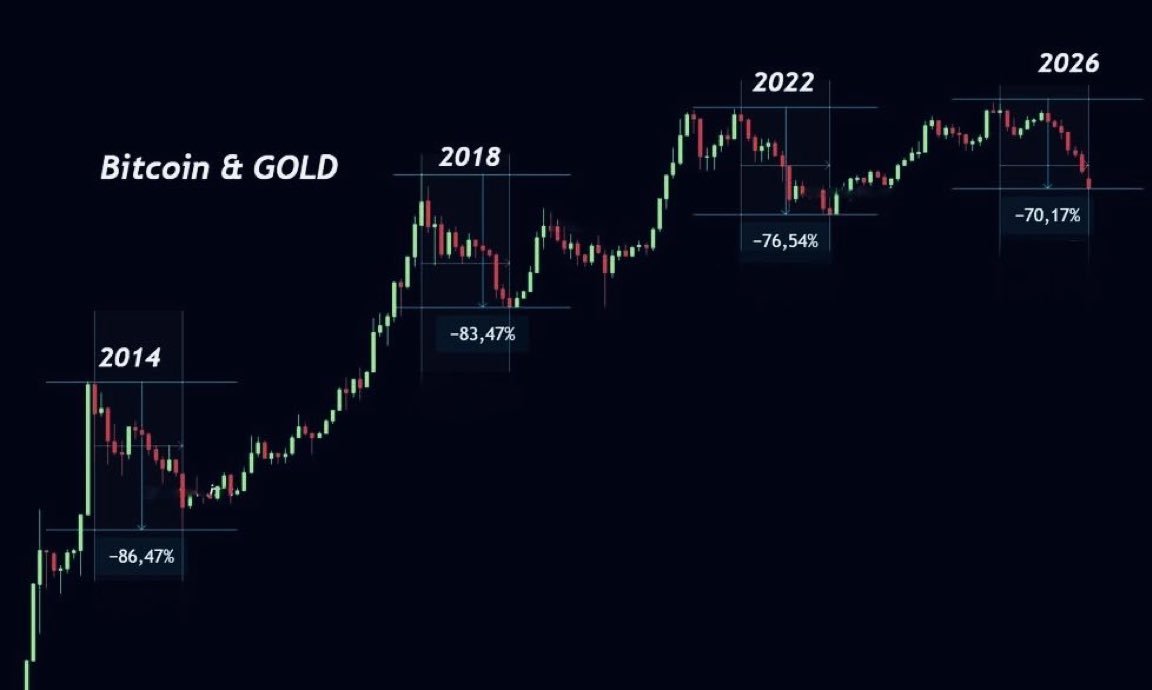
It fell to -0.9 in March, a level that historically coincided with market bottoms. at the same time, $BTCThe gold-to-gold ratio has fallen by about 70%, creating a trough structure similar to those seen in 2014, 2018, and 2022.
Van de Poppe said this divergence suggests Bitcoin is moving independently from traditional safe-haven assets, and that this evolution could signal a change in market behavior.