Bitcoin continues to recover from the June crash, but remains trapped below a major resistance cluster. Although buyers managed to protect the lows on the lower time frame, the market is still approaching a critical confluence that will determine whether the recovery is extended or another rebound.
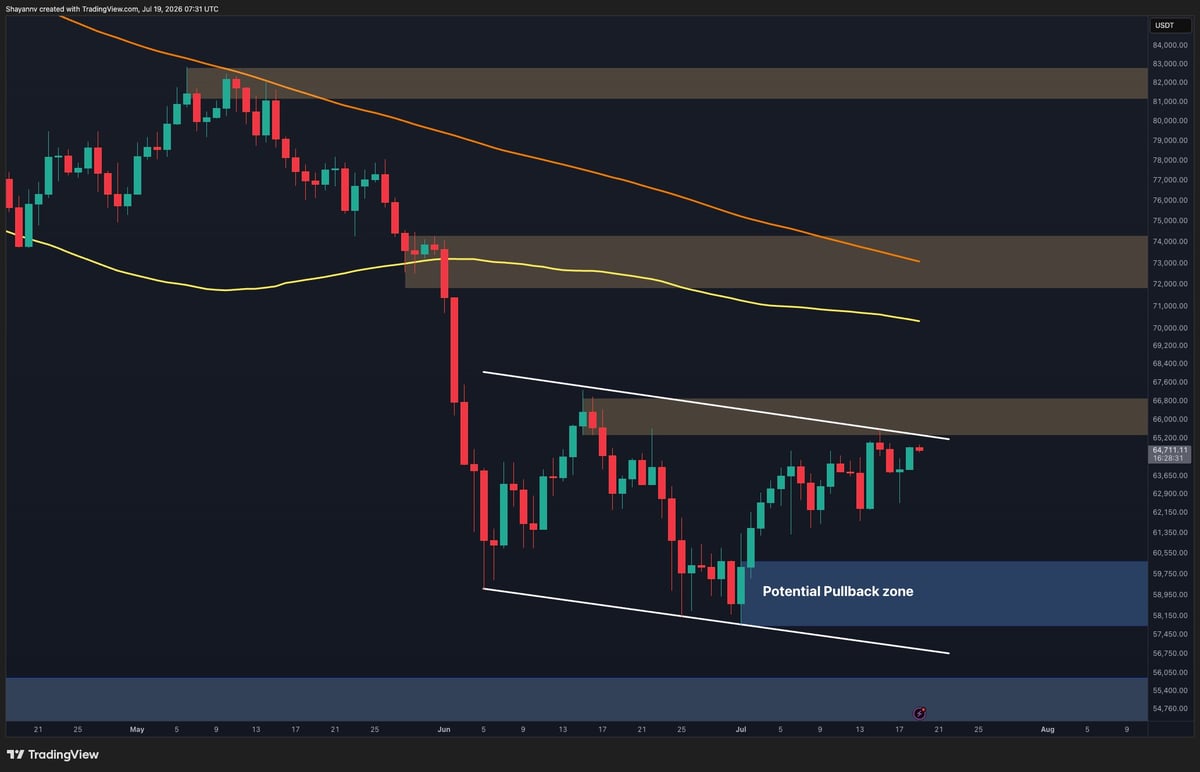
$BTC Price analysis: daily chart
In terms of time frame of the day, $BTC continues to trade below its 100-day and 200-day moving averages, and the overall trend is tilted to the downside.
The asset is currently approaching the $65,000 to $66,5000 supply zone, which also coincides with the downward long-term trend line. This confluence has capped any recovery attempts since the sharp collapse in early June and is a key barrier that bulls must regain in order to move into higher time frame structure.
A successful breakout above this area will expose the next resistance level between $72,000 and $74,000. However, another rejection from the current supply zone could trigger a corrective move towards the $58,000-$60,000 support area, which currently represents the most important demand zone on the daily chart.
$BTC/USDT 4 hour chart
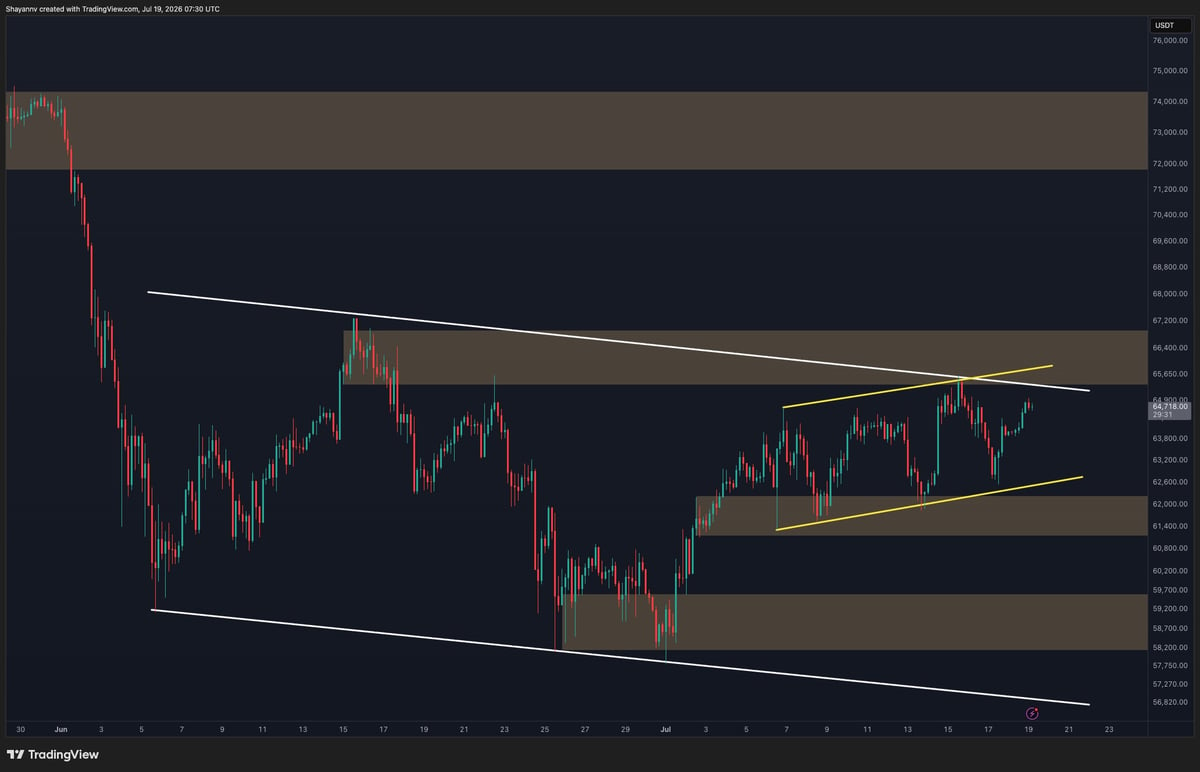
The 4-hour chart shows Bitcoin consolidating in an uptrend channel after a series of new lows throughout July.
$BTC is once again testing the upper bound of the channel while approaching the higher timeframe supply zone around $65,000-$66,5000. This forms a major confluence of resistance and suggests that bullish momentum is entering an important decision area.
As long as Bitcoin remains above the $61,000-$62,000 support zone, it remains likely that buyers will maintain their short-term advantage and try to break through the overhead resistance again.
However, failure to overcome the channel resistance, downtrend line, and confluence of supply zones could result in another pullback towards the $58,000-$60,000 demand area. This price action pattern usually signals a potential decline, so Bitcoin is testing a low demand zone and preparing for further bearish legs.
sentiment analysis
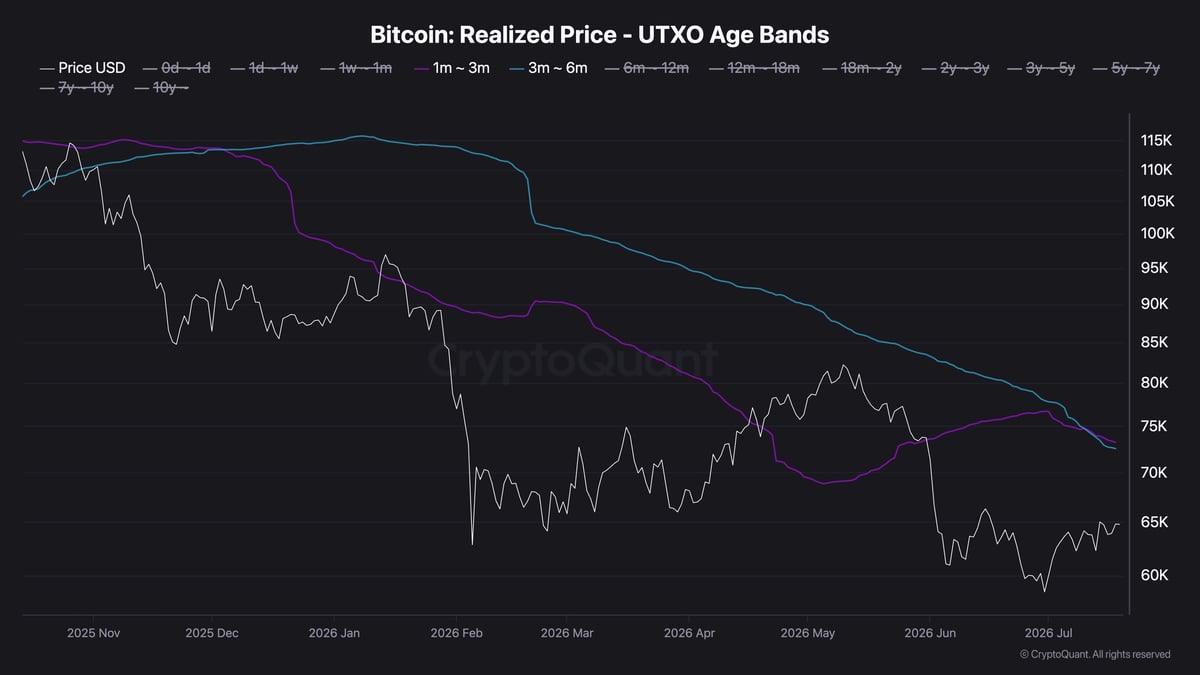
Realized Prices The UTXO age bands show that the realized prices for the 1-3 month and 3-6 month holder cohorts have converged near the current market structure, both in the low $70,000 region.
Historically, the convergence of cost bases for these young holders often reflects periods of market transition, as recently accumulated coins start trading at similar prices. At the moment, both realized price levels are still well above Bitcoin’s spot price, suggesting that these cohorts are still carrying unrealized losses.
This strengthens the technical image. Although Bitcoin has recovered from its June lows, it remains below its recent investor realized cost base, suggesting that sentiment has not fully returned to favoring sustained accumulation.
A recovery above these realized price levels would strengthen the case for a broader trend reversal, while a continued rejection below these would support the view that the current rally is still a rescue rally within a broader bearish structure.