


Ethereum ($ETH) is showing strong technical signs of a near-term bottom reversal, with a sharp rally to $2,163 expected.
Ethereum targets $2,163 after double bottom completes
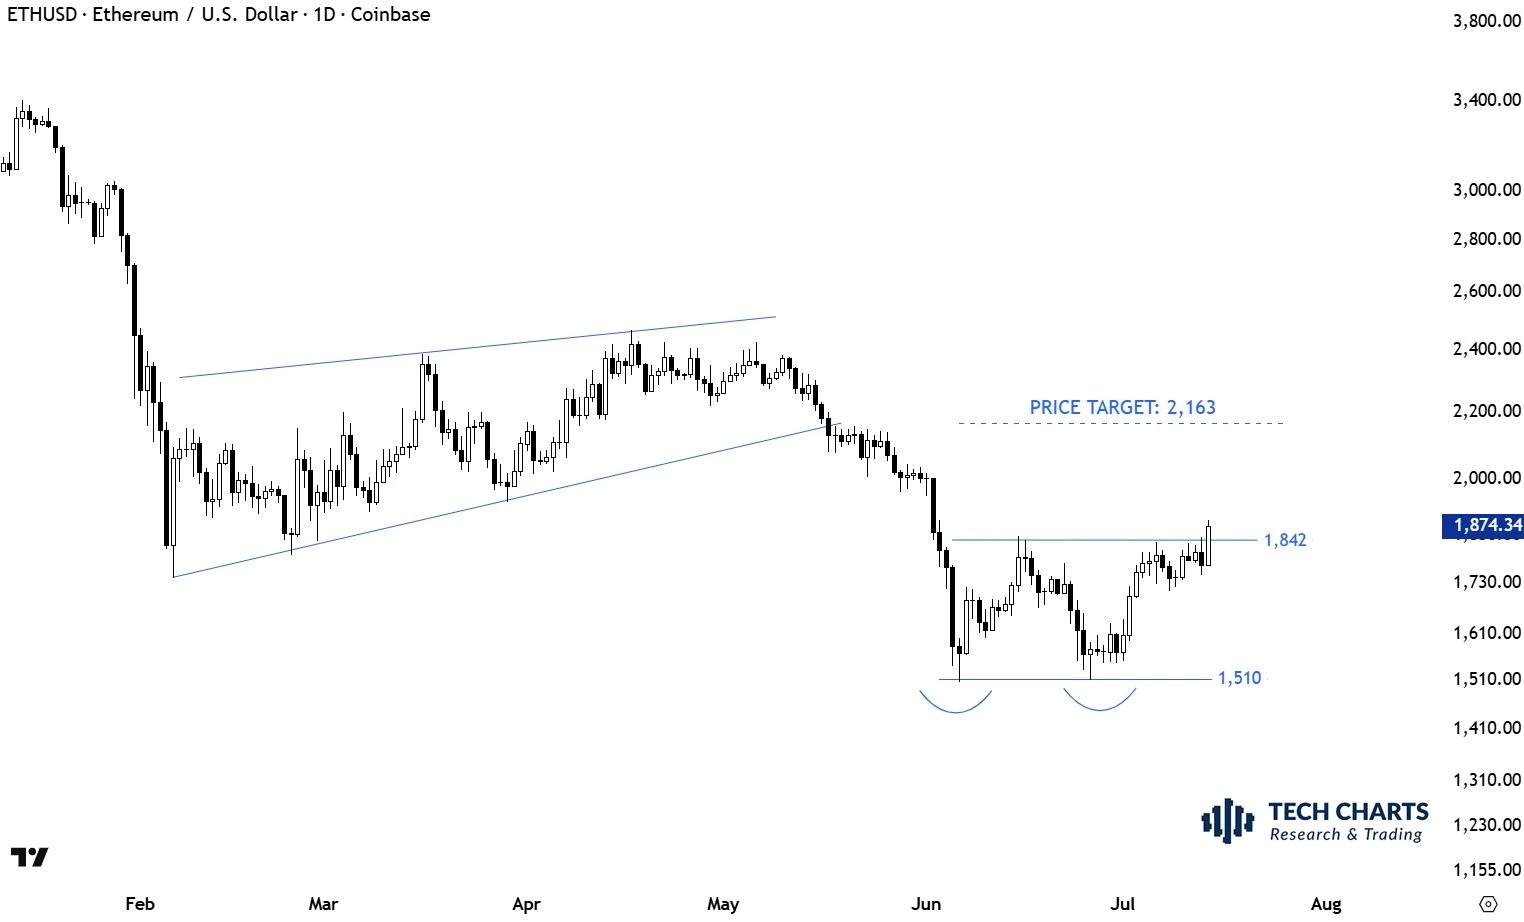
As shown in the figure below, $ETH A typical double-dip reversal pattern is clearly formed near the $1,510 support. Moreover, just two days ago, the coin broke above the neckline resistance at $1,842 after a period of consolidation. At press time, $ETH continues to maintain this bullish momentum, trading at around $1,883 (up 6.88% in the past 24 hours).
Source: Tech Charts
According to veteran chartist Axel Kibar, in this setup, the upside target is predicted to be $2,163, based on the pattern’s movement from the double bottom to the neckline. This also follows a similar short-term bullish forecast made by analysts just three days ago, indicating continued bullish momentum in the reversal.
Further supporting this hypothesis is the multi-month trendline, which shows further increases from the February to May lows. This trajectory means buyers are consistently stocking up even as prices rise, further reinforcing the bullish momentum mentioned above.
Recent trends fostering upward bias
In addition to the technical analysis above, EthSystems, a spin-off from the Ethereum Foundation, was recently launched as an independent commercial research and engineering company. The Ethereum community expressed optimism about the event, seeing it as a demonstration of Ethereum’s commitment to providing blockchain privacy to highly regulated institutions.
In addition, today’s cooler than expected inflation statistics encouraged investor inflows into crypto assets. In addition to individual investors, institutional investors continue to accumulate coins, with Bitmine Immersion Technologies currently holding 5.77 million coins. $ETH Tokens (approximately 4.8% of circulating supply).
Main levels to pay attention to
Important levels to watch now include resistance at the double bottom neckline between $1,842 and $1,850. Downside penetration below this threshold can invalidate a bullish setup.
Further resistance lies between $1,900 and $2,000, marking the May-June highs just before the sell-off.
A breakout of these two zones, combined with increased trade volume, would pave the way to the $2,163 target.


