


Ethereum is trading at $1,664 as of June 15, rebounding from a liquidity sweep that bottomed around $1,500 earlier this month and challenging the short-term downtrend line that has limited any recovery attempts since the June crash began.
$ETH Daily chart: Liquidity sweep completed, but downtrend still remains
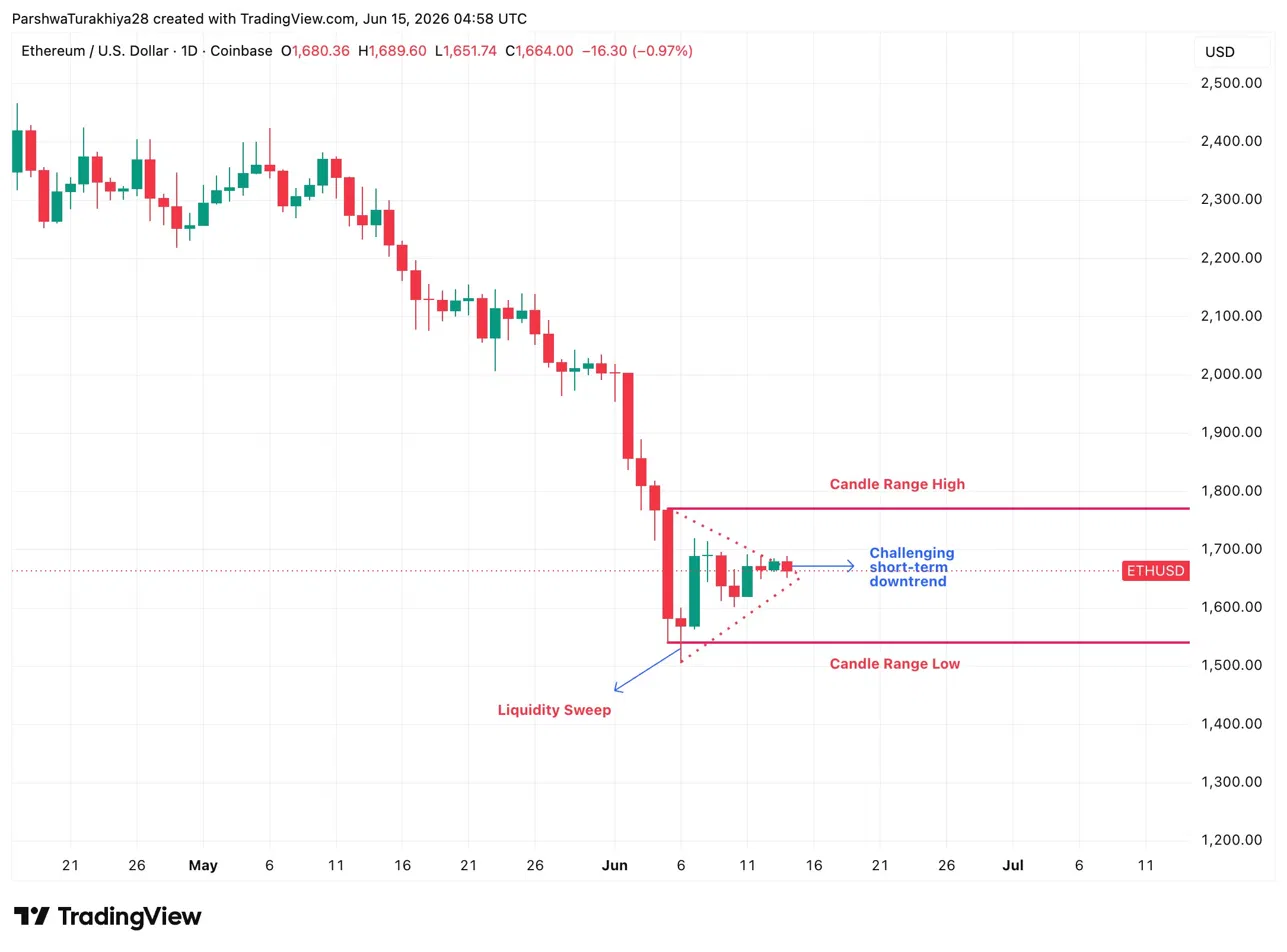
The daily chart shows a clean sweep of liquidity below $1,500 and a subsequent recovery attempt, now looming over the downtrend line near $1,700. The candlestick high is at $1,800 and the candlestick low is at $1,500, making it a battleground right now.
A daily close above $1,700 is required for the price to break the short-term downtrend that has defined all sessions this month. Above the current price, the first meaningful resistance level from the weekly structure is $2,282, followed by $3,335.
- Resistance: $1,800 (candlestick high), $2,282 (weekly structure)
- Support: $1,500 (lowest of candle range), $1,069 (multi-year channel support)
says saylor $ETH lost the financial premium
Michael Saylor: Investors are losing confidence in Ethereum
On June 12, 2026, at the Bitcoin Corporate Day event, Michael Saylor @saylor discussed Bitcoin’s rise to market power. He said that, with the exception of stablecoins, Bitcoin’s dominance in the cryptocurrency market is increasing… pic.twitter.com/xWqf6ONb0a
— Wu Blockchain (@WuBlockchain) June 13, 2026
At the Bitcoin Corporate Day event on June 12, Michael Saylor said that investor confidence in Ethereum has collapsed. He pointed to the rise in Bitcoin’s dominance from around 41% in 2021 to nearly 70% today, excluding stablecoins, as evidence that the market has made its choice. Thaler argued that $ETH is currently in intense competition with Solana and BNB, and the financial premium has completely dried up, leaving practicality as the only remaining value argument.
The timing of speaking $ETH is trading at its lowest level since 2023 and has been significantly lower than Bitcoin on every time frame this year. Regardless of whether Saylor’s framework is correct or whether the Bitcoin maximalists’ cycle-peak narrative is correct, the market has largely voted in his favor so far.
Why $1,069 is more important than short-term levels
With Ethereum $ETH According to this multi-year channel pattern, I believe $1,070 will be one of the best buying opportunities on the chart. https://t.co/LNkygeXO5n pic.twitter.com/ZLHNjiUPJl
— Ali Charts (@alicharts) June 14, 2026
Ali Charts marks $1,069 as one of the best buying opportunities. $ETH Charts based on multi-year channel patterns. This level coincides with the 2022 bear market floor before a rally towards $4,868. If we want to revisit $1,069, it would imply a 36% decline from the current level and we would have to move down the $1,500 candlestick range first.
Although this setting is not a basic case, it is a defined level of historical importance. whoever has it $ETH Data to that zone has a clear reference point for accumulation based on multi-cycle data.
$ETH Derivatives: Short products hit hard as options volumes double
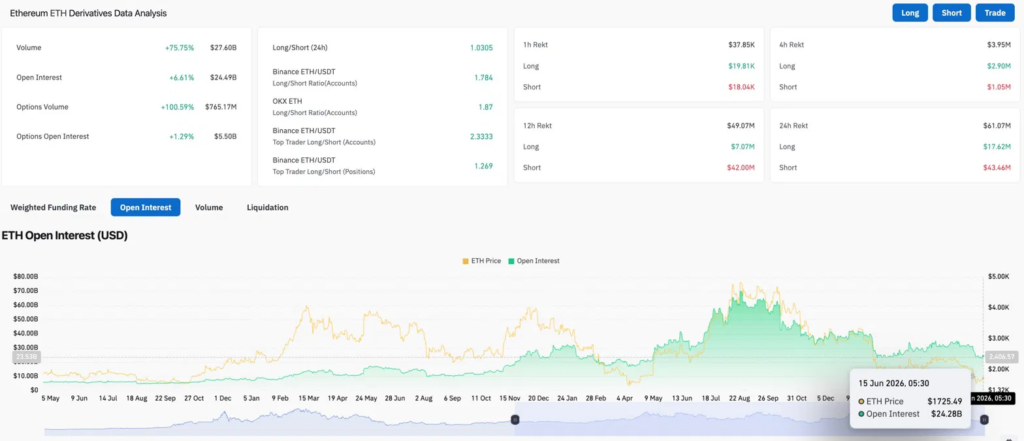
Volume increased by 75.75% to $27.6 billion, and open interest increased by 6.61% to $24.49 billion. Options trading volume more than doubled, increasing 100.59% to $765.17 million, indicating traders are positioning for clear moves rather than spot speculation. The long/short ratio is approximately neutral at 1.0305.
In 24 hours, short positions of $43.46 million were liquidated against long positions of $17.62 million. The bears absorbed more than twice as much pain as the bulls, which is consistent with the short squeeze dynamics that triggered the rally from $1,500.
Ethereum price prediction for June 16, 2026
- upside: A daily close above $1,700 will break the short-term downtrend and target $1,800. If you continue to do short-term liquidations and maintain there, you will be on your way to $2,282.
- Downside: Rejected at $1,700 and closes below $1,600, the candlestick range remains low at $1,500. A break below $1,500 removes the last short-term floor and puts multi-year channel support at $1,069.