Ethereum is making a notable recovery after plummeting towards the $1.5,000 area. Although the rebound has improved near-term sentiment, the overall structure remains bearish on higher time frames. $ETH It is still trading below the major moving averages and the long-term downtrend line. Perhaps the coming sessions will determine whether this move develops into a sustainable recovery or just a relief rally within a larger downtrend.
Ethereum Price Analysis: Daily Chart
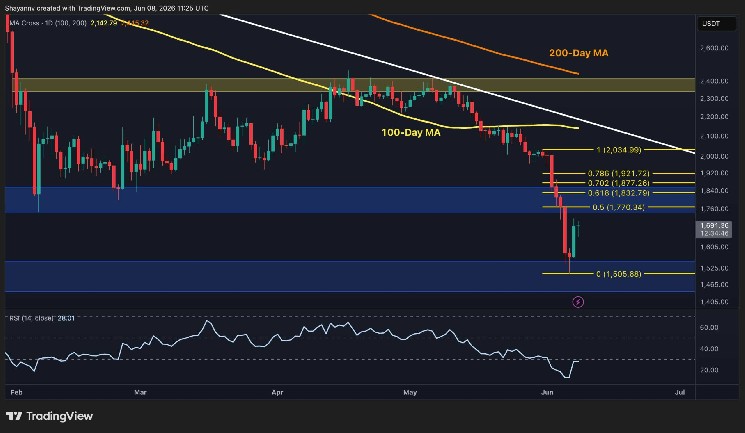
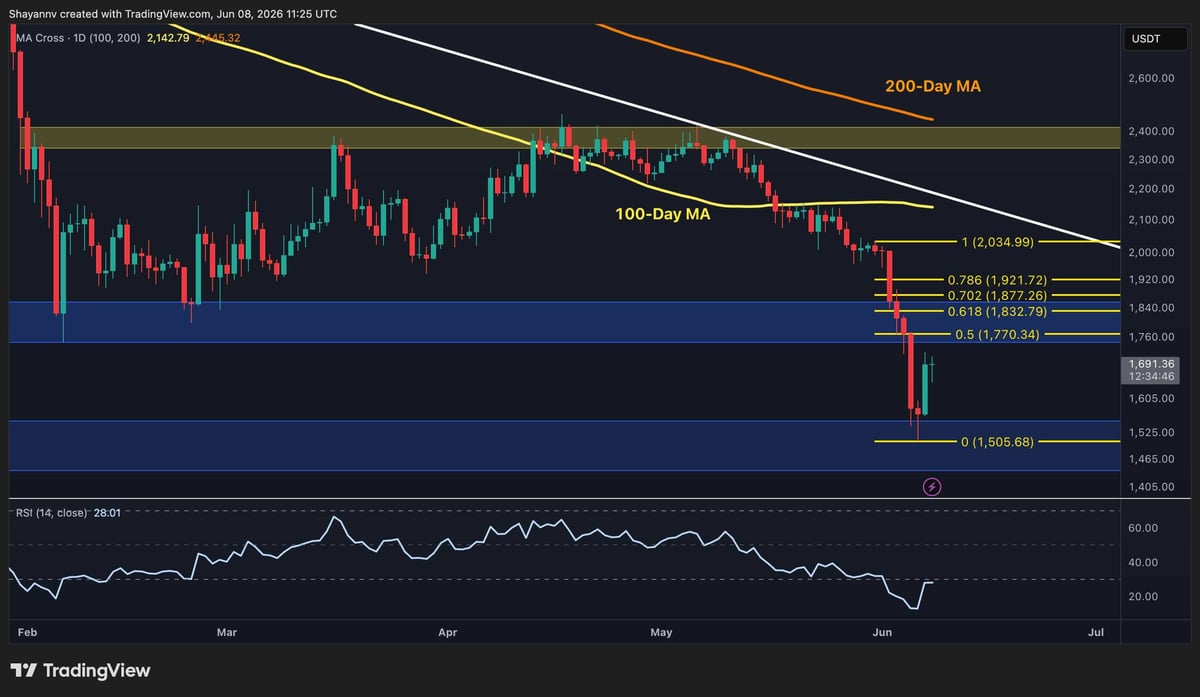
In the daily time frame, $ETH Despite the recent bounce from the $1.5,000 support area, it is still under significant technical pressure. Prices briefly fell below the key demand zone around $1.5,000, but buyers then gathered and rebounded towards $1.7,000.
The broader market structure continues to favor sellers. Ethereum is trading below both its 100-day moving average near $21,000 and its 200-day moving average near $24,000. This indicates that the trend on the higher time frame remains bearish. Additionally, the long-term downtrend line extending from the previous high continues to limit any upside attempts and strengthens the prevailing downtrend.
The last leg of the decline establishes a clear bearish impulse, and the Fibonacci retracement level highlights a potential recovery target that could cause sellers to re-enter the market. The first notable resistance lies at the 0.5 retracement level near $1.77,000, followed by the 0.618 level at $1.83,000, and then the 0.786 retracement near $1.92,000.
If sellers continue to be able to control the broader trend, we expect these levels to act as potential rejection zones. Therefore, a continued pullback could extend towards this resistance cluster, but traders should closely monitor price trends around these areas. These regions could be attractive areas for new supply and further bearish continuation attempts.
$ETH/USDT 4 hour chart
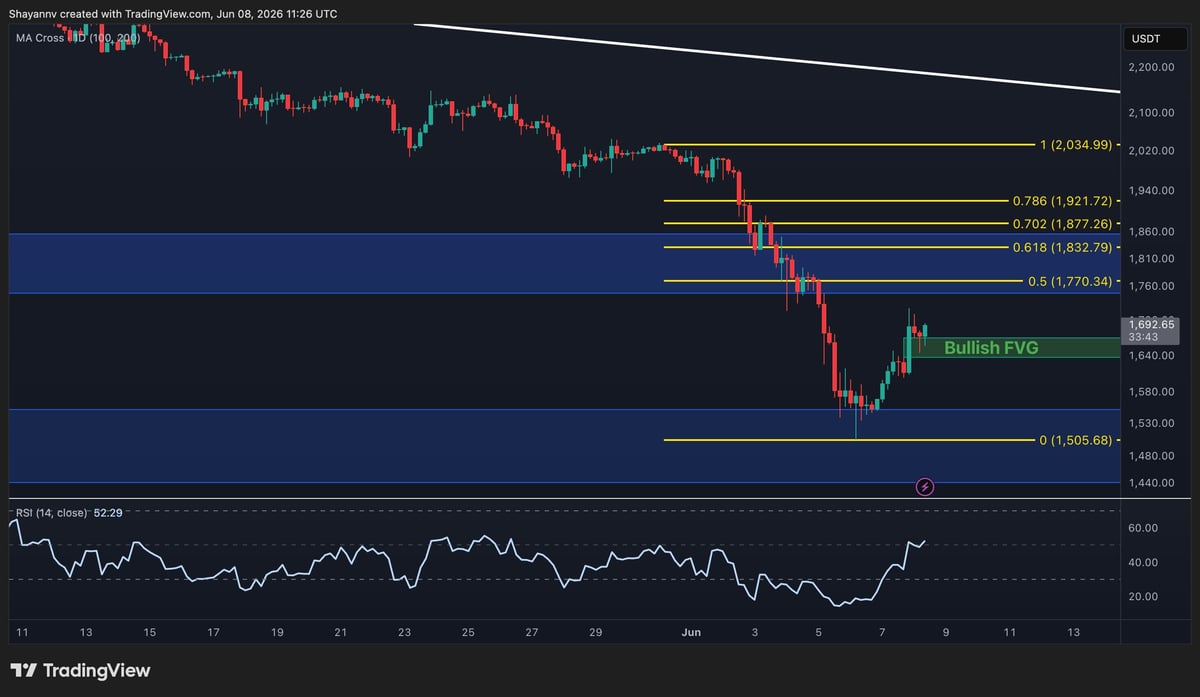
Lower time frames reveal a more constructive short-term situation. After capitulating to a low of $1.5,000, $ETH It has formed a strong rebound and is currently receiving support from a bullish fair value gap located around $1.64,000.
This region is acting as an immediate demand zone and could provide support in the event of a short-term pullback. The recovery has also brought the RSI above the midpoint level, indicating that momentum is improving after an aggressive pullback.
However, the market is still below the key Fibonacci resistance cluster between $1.75,000 and $1.85,000. This range currently represents a key liquidity zone where sellers may attempt to regain control. It seems possible to continue in that area as long as $ETH Still above the bullish fair value gap.
If buyers can maintain their momentum and regain the $1.77,000 level, a bigger short squeeze could develop towards $1.83,000 and $1.92,000. On the other hand, losing the fair value gap support around $1.64,000 weakens the recovery structure and increases the likelihood of another test of the $1.5,000 low.
sentiment analysis
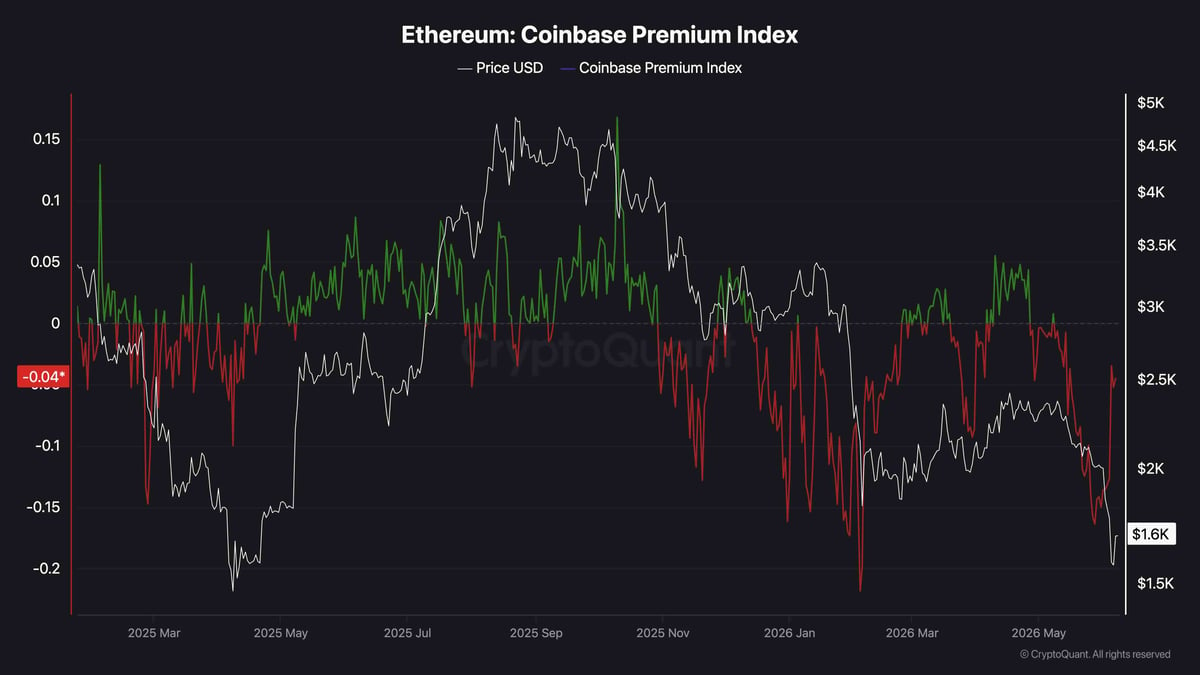
The Coinbase Premium Index provides additional insight into current market sentiment. This metric measures the price difference between Coinbase and offshore exchanges and is often used as a proxy for US institutional demand.
The chart shows that the Coinbase Premium Index has spent most of the recent period in negative territory, coinciding with Ethereum’s extended decline from $5,000 to its current cycle lows. The latest reading is still below zero at around -0.04, indicating that US spot demand is still relatively weak.
That said, the index has rebounded sharply from recent extremely negative readings around -0.15. Historically, such large negative premium levels often appear during periods of capitulation or strong selling pressure. The recent recovery suggests that the selling momentum is waning, even if strong accumulation has not yet returned.
For a more sustained bullish reversal, ideally the Coinbase Premium Index should return to positive territory and remain consistently above zero. Until then, the data suggests that Ethereum’s current rally is being driven by its release from an oversold situation rather than by clear evidence of active institutional accumulation.