


Ethereum price has fallen to around $1,630 after falling about 4% in the past 24 hours, but new technical signals and a market-wide liquidation keep traders focused on the risk of another move towards a major support level.
According to data from crypto.news, Ethereum ($ETH) began trading around $1,628 on June 10 and has fallen about 4% in the past 24 hours. This move coincided with Bitcoin (BTC) falling 4.7% to around $61,050, which pushed the total cryptocurrency market down 3.5% to around $2.12 trillion. $XRP ($XRP) also fell below $1.15, indicating that the decline extended beyond Bitcoin and Ethereum.
Market participants have linked the decline to weak risk appetite, security-related concerns and a wave of leveraged liquidations.
During the decline, Bitcoin fell from around $64,100 to $61,049, with analysts continuing to monitor whether the largest cryptocurrency can sustain support above $60,000. If this level continues to hold, it could open the door for a recovery towards $63,400, but a break from that level could expose the $58,000-$59,000 area.
Clearing and funds flows increase market pressure
According to derivatives market data, crypto liquidations amounted to approximately $468 million in the past day. Bitcoin’s decline alone wiped out around $130 million worth of positions as the price plummeted from the $64,100 area.
Liquidation heat map data cited by market participants showed that approximately $331 million in long liquidations and $1.84 billion in short positions remained vulnerable to sudden reversals, highlighting the potential for continued volatility if prices change direction quickly.
At the same time, exchange-traded fund activity has provided mixed signals. According to SoSoValue’s flow data, the US Spot Bitcoin ETF recorded net outflows of $91.37 million, while the Spot Ethereum ETF attracted inflows of $82.37 million.
Technical indicators point to significant Ethereum support
Commenting on the current market, analyst Ted Pillows said that Ethereum is struggling to regain the $1,700 level after the recent decline.
According to the chart shared by the analyst, this area acted as a major bottom in February 2026, but then turned into resistance as sellers continued to defend this zone.
“This is the zone where Ethereum bottomed in February 2026 and is currently acting as resistance. $ETH If we can’t recover from this, we could see another big low. ”
Pillows identified the $1,540 area as the next key support level and warned that Ethereum could be exposed to further decline if it fails to recover above $1,700.
Additional technical indicators indicate that the bearish situation continues. On the daily chart, Ethereum is trading below the supertrend resistance near $1,850, a level that technical traders often monitor for signs of a trend reversal.
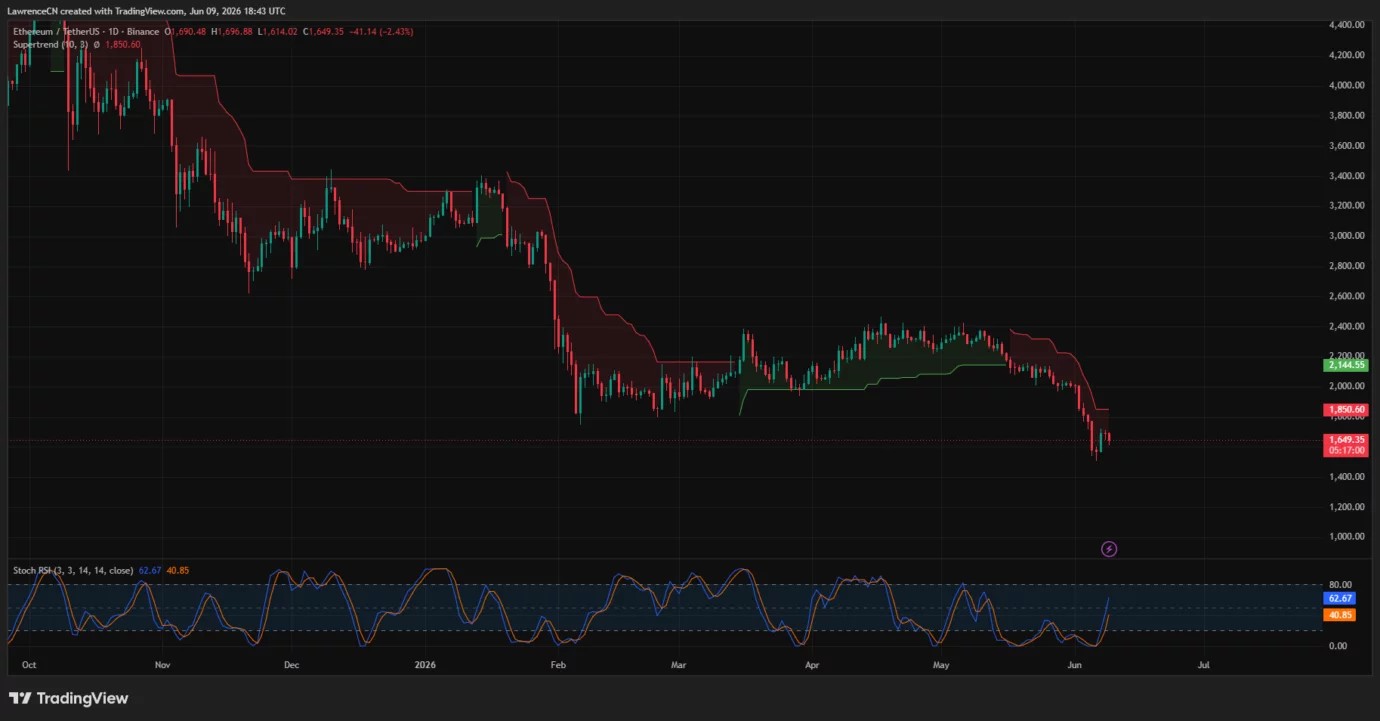
The Stochastic RSI has rebounded from oversold territory and could support a short-term rescue rebound, but the indicator has not yet confirmed a broad change in direction.
The long-term chart shows another important level. Weekly price action shows that Ethereum is testing support near $1,530, a zone that was previously held during the big declines in 2023 and 2025.
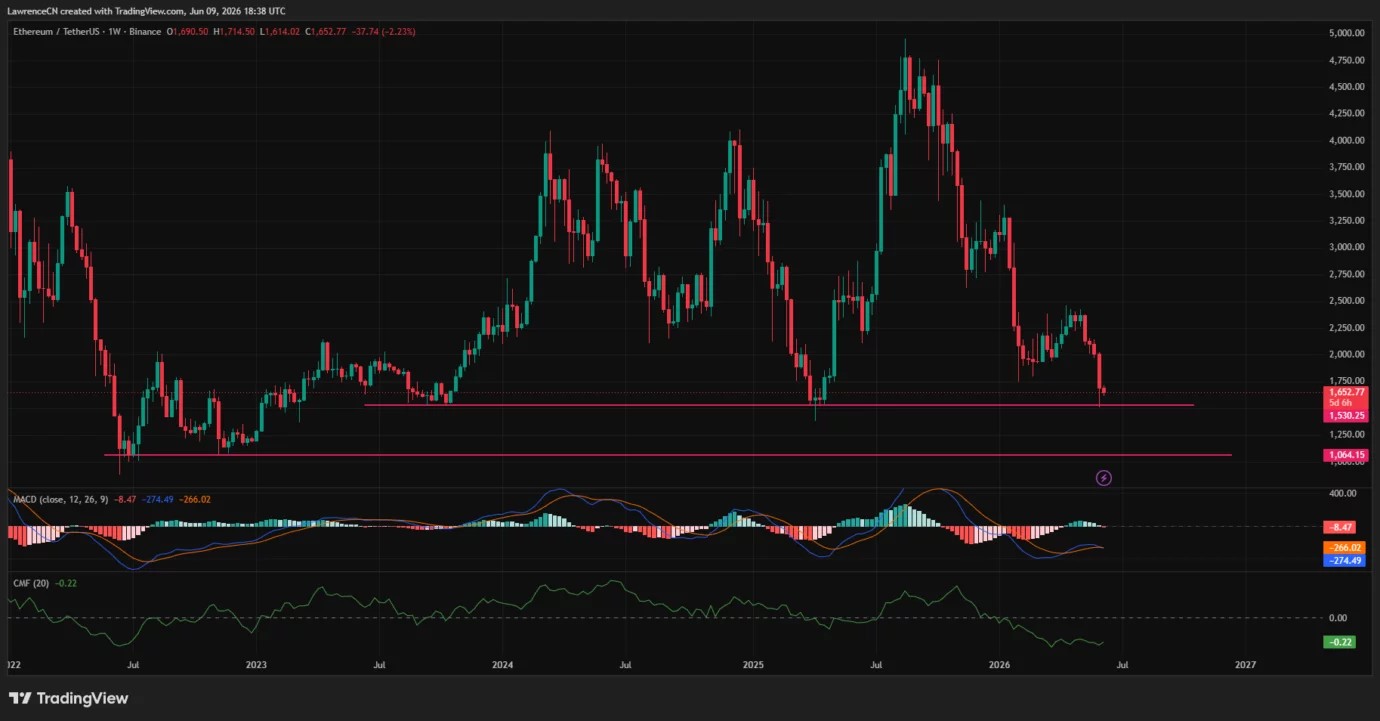
Momentum indicators remain weak, with the weekly MACD remaining in bearish territory and the Chaikin money flow indicator near -0.22, indicating continued capital outflows.
According to the technical settings displayed on the weekly chart, a decisive break below $1,530 could expose the next major support level near $1,064.
However, a sustained recovery will likely require Ethereum to regain resistance levels around $1,700 and eventually move back above the daily supertrend around $1,850.