


Ethereum price is hovering around the neighborhood today due to risk-off trends and pressure on altcoins. 2,130 On a daily pivot as sellers limit bounces to 2,140-2,170.
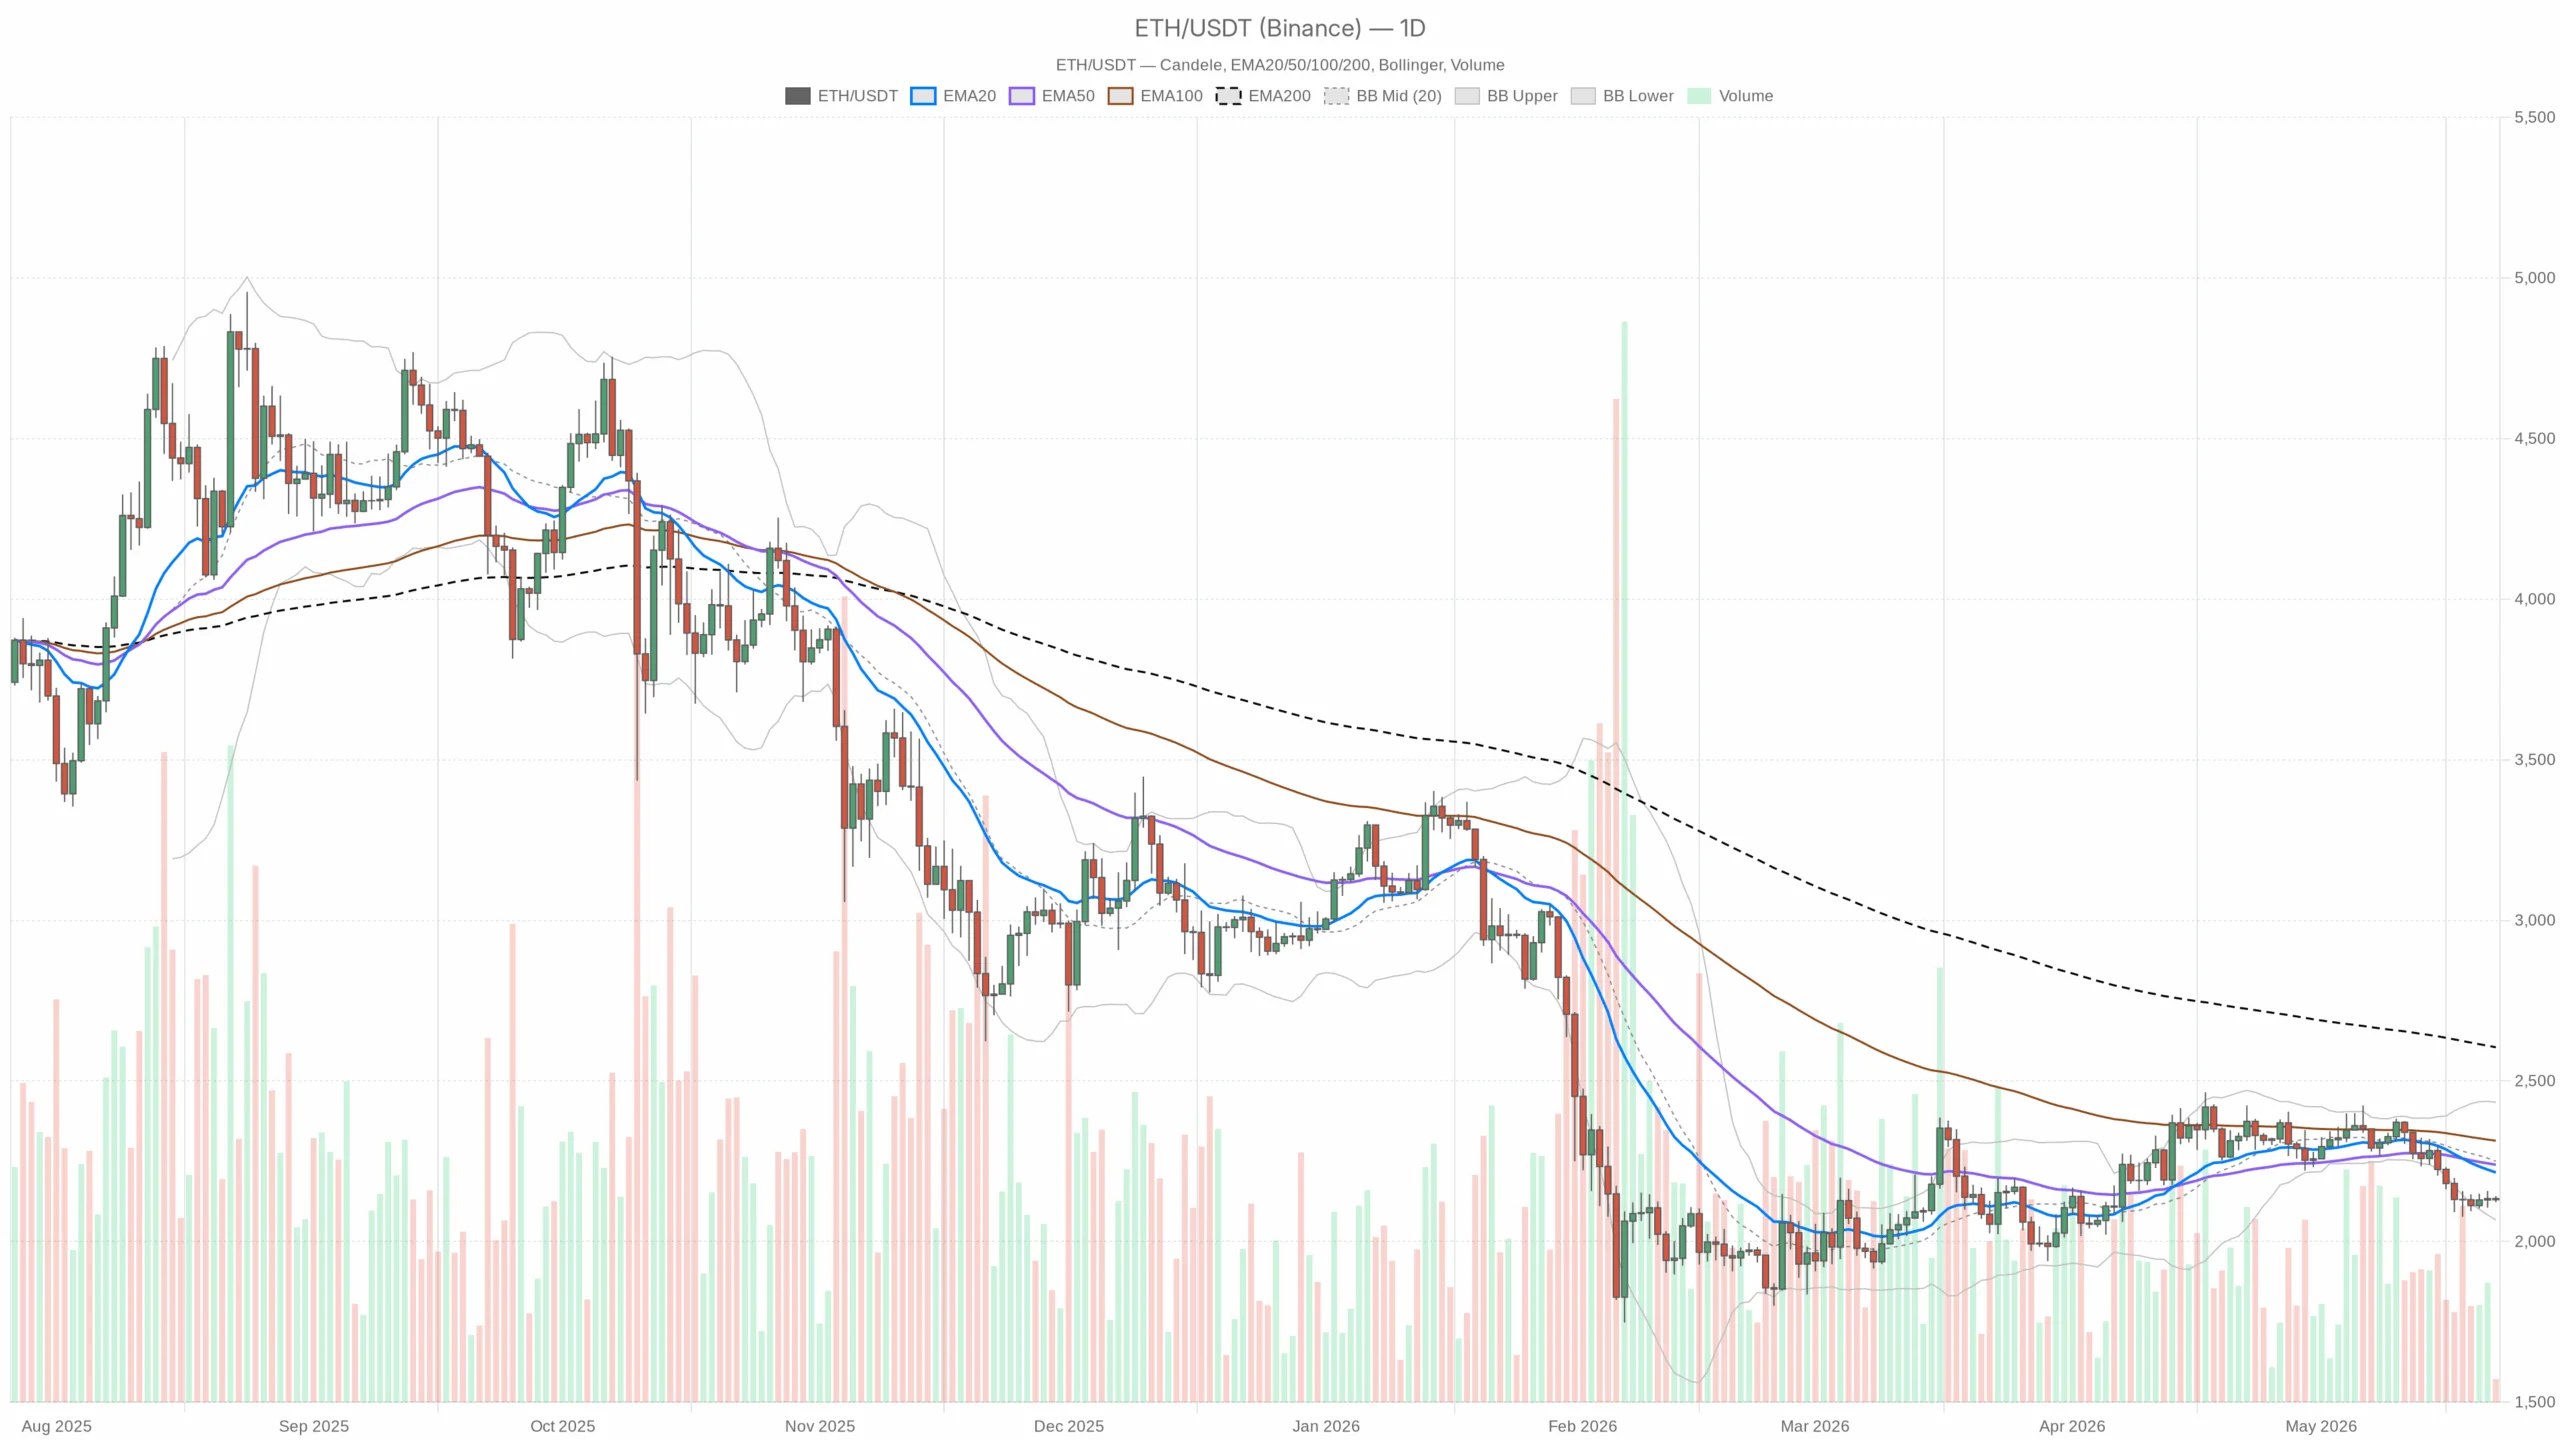
Market logic across different time frames
Tape, on the other hand, is risk-off. Bitcoin advantage ~58% Supply continues to arrive in the 2,140-2,170 range, but dip demand reacts near the lower bound of the Bollinger rail.
However, since the daily structure is down, the rise in mean reversion becomes significant only if the major moving averages are recovered. Until then $ETH Retrieve the 20/50 day EMA cluster (2,215~2,239), the path of least resistance points to the lower band and previous liquidity pocket.
Daily (macro bias = bearish): Trends prevail over mean reversion as momentum remains weak. Downside risk still remains given that Ethereum price is below all major EMAs today. Near the lower limit of Bollinger Band 2,067 If 2,120 fails, it becomes a magnet. Volatility is moderate, so breaks can range throughout the day.
1H (tone = neutral, negative aspects softened but not reversed): Price is stuck at the 20/50 hour EMA near 2,132 and the RSI is mid-pack. It’s not about strength, it’s about balance. Bulls are looking at the 200-EMA (~2,171) claim more than a bounce.
Having said that, 15 meters (Execution Context = Neutral Chop): Micro compression surrounds 2,130 with a flat MACD and a tight band. break from 2,129~2,132 I usually expand 8 to 12 points first. Follow-through still depends on the first half.
Indicative evidence (with plain English reading)
daily time frame
- RSI(14): 36.7 — Weak, not oversold. Sellers has the ball and has plenty of room until he runs out.
- MACD: Line -44.52, Signal -25.66, Hist -18.86 — Downward momentum continues. There is no bullish crossbreak yet.
- EMA: 20D 2,215.05, 50D 2,238.97, 200D 2,604.79; Price 2,130.28 — Price is below the bearish stack (20 < 50 < 200). Trend pressure is decreasing.
- Bollinger Bands: Middle 2,250.30, Upper 2,433.57, Lower 2,067.02 — trading in the bottom quartile. Mean reversion bounces may occur, but initial testing may be limited in the mid-band.
- ATR(14): 68.21 — Expected daily change of approximately $70. You need margin when sizing your position.
- Pivot levels: PP 2,131.30, R1 2,140.37, S1 2,121.20 — Price crosses the pivot. Slips below S1 often accelerate toward the approximate number (2,110/2,100).
1H time frame
- RSI(14): 48.89 — Balanced. Neither team had any momentum that day.
- MACD: Line -0.20, Signal 0.51, Hist -0.71 — Slight downward bias. Larry quickly disappears.
- EMA: 20H 2,131.82, 50H 2,131.59, 200H 2,171.31; Price 2,130.28 — Pinch at 20/50H. The 200H above is the hurdle for changing the tone.
- Bollinger Bands: Middle 2,132.39, Upper 2,145.21, Lower 2,119.56 — Range trade. Pushing either band tends to stop it from running.
- ATR(14): 8.47 — Expect choppy bursts between $8 and $10. Daytime stops should be tight or carefully planned.
- Pivot Level: PP 2,129.87, R1 2,133.75, S1 2,126.40 — Micro Battlefield. Losing S1 typically moves the price to a lower band.
15m time frame
- RSI(14): 46.82 — Slightly soft. Momentum is tentative.
- MACD: Line -1.30, Signal -1.38, Hist 0.08 — Flattened. Coiled for short movements.
- EMA: 20 meters 2,131.07, 50 meters 2,132.38, 200 meters 2,131.51. Price 2,130.09 — all clustered. Breakout pending.
- Bollinger Bands: Middle 2,131.62, Top 2,139.23, Bottom 2,124.01 — Tightening of the bands indicates impending expansion.
- ATR(14): 4.22 — A great microwave. Your scalp may get chopped.
- Pivot Level: PP 2,130.84, R1 2,131.64, S1 2,129.28 — The play above or below this 2,130 pocket often defines the next 10 points.
scenario
Bullish path (currently countertrend): Stay above 2,121 (Daily S1) and get back 2,140 (Daily R1). Intraday acceptance exceeding 200-EMA first half (~2,171) will begin to squeeze into the 20/50 day EMA zone 2,215~2,239. A daily mid-band around 2,250 is unreasonable. Invalid: Daily close below 2,120 or repeated rejections at 2,140. Lows below 2,119 hands return to sellers.
Bearish path (main scenario): A failure between 2,140 and 2,170 would roll back through 2,121 and 2,110 toward the daily lower band of ~.2,067. If broader concerns persist, an expanded investigation to 2,000 people cannot be ruled out, given that the ATR is approximately $70 per day. Invalidation: The downtrend will be invalidated if the daily close is above 2,215 (20-day EMA) and H1 remains above ~2,171. If that happens, I’ll probably have to re-evaluate shorts.
Positioning and risk
For now, the tape rewards patience. Due to daily downtrend and intraday balance, $ETH First prove that more than 2,171 is acceptable, then 2,215 to 2,239. For bearish positioning, a cleaner spot comes in 2,140~2,170 Risk is defined relative to the 20-day EMA. For bullish positioning, let price do its thing. Recovering and sustaining the 1H 200-EMA will change the game. Otherwise, treat the bounce as an uptrend within a downtrend.
Additionally, volatility is live but not extreme (ATR ~68). falsification is expected 2,130 pivots Size it so you don’t have to make a decision even after a full day of swinging. Uncertainty remains high due to the risk-off background and high overhead supply. Plan your entry according to your level, predefine your exit, and be flexible even when time frames start to coincide.
Overall, the trend remains bearish while the major moving averages cap any upside. The tone will likely change once we move above the 200-EMA and 20/50-day cluster of the first half of the year. If that fails, pressure continues towards the previous lows and lower bands.


