


At 8:00 a.m. ET on May 13, 2026, Bitcoin was holding near $80,500 as traders weighed a near-term cooling of momentum against a broader bullish structure that still shows no intention of quietly exiting. Bitcoin’s price reached $80,550, with a market cap of $1.61 trillion and 24-hour trading volume of $40.58 billion, as the world’s largest crypto asset continued to consolidate below the stubborn $82,000 resistance area, like a caffeinated trader refusing to log off at 3 a.m.
Important points:
- The indicators remained mostly neutral, with Bitcoin hovering around $80,550 as of May 13, 2026.
- According to market data, Bitcoin volume reached $40.58 billion, with resistance forming near $82,800.
- The chart suggests that Bitcoin risks falling towards $77,000 if it does not regain $81,500.
Bitcoin chart outlook
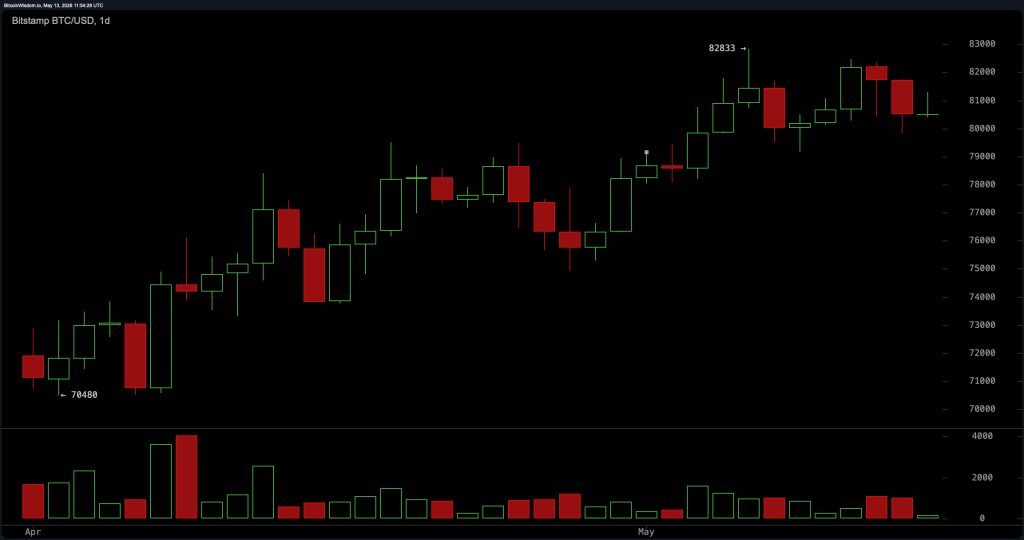
Bitcoin’s daily chart continued to show a cautiously bullish trend despite multiple rejections near the $82,000 to $82,800 range. Bitcoin’s broader structure remained constructive following consistent new lows from April’s lows around $70,480, although buyers repeatedly defended a return to the high $70,000 area.
Still, recent candlesticks have shown hesitation near the local high of $82,833, suggesting momentum may wane in the near term as traders assess whether there is enough energy in the market to attempt another breakout. Consolidation around key moving averages also strengthens the current neutral-to-bullish bias, with support held between $79,000 and $80,000. A confirmed move above $81,500 could reopen the path to a higher resistance target, but it is clear that the market is looking for evidence before holding another party.
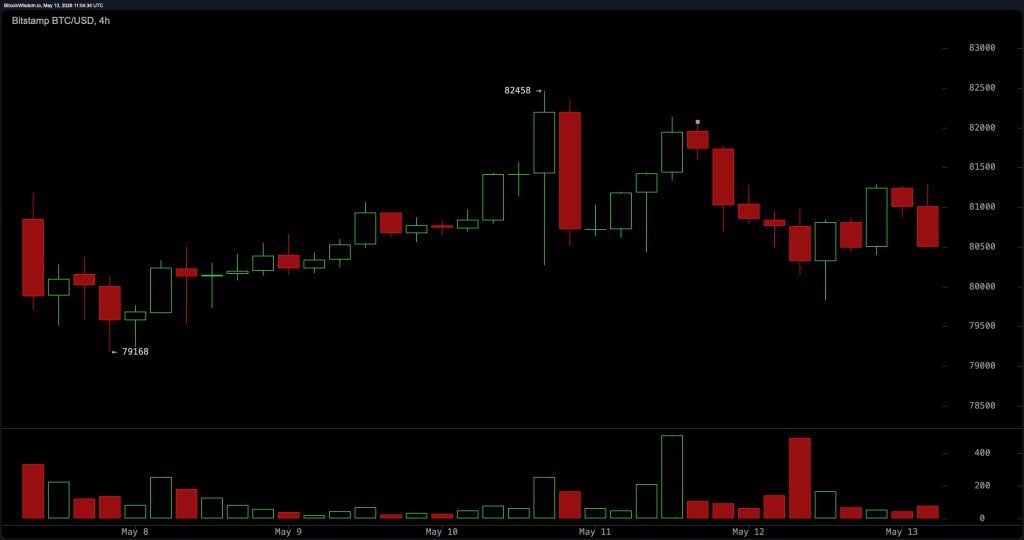
On the 4-hour chart, Bitcoin appeared to be trapped in a tight consolidation range between support at around $80,300 and resistance at $81,500 after rebounding from a peak at $82,458. A series of lows and highs that developed after this move suggested a short-term distribution rather than an aggressive continuation, while a decline in rebound volume suggested that traders were becoming increasingly cautious near the overhead resistance.
Despite this hesitation, the short-term moving averages remain in a constructive trend, helping to maintain an underlying upward bias. According to the oscillator, momentum remained neutral during the day, reinforcing the view that the market is entering a cooling phase rather than a complete reversal. For now, Bitcoin remains stuck in a classic stand-off between exhausted bulls and opportunistic bears, with neither side looking ready to blink first.
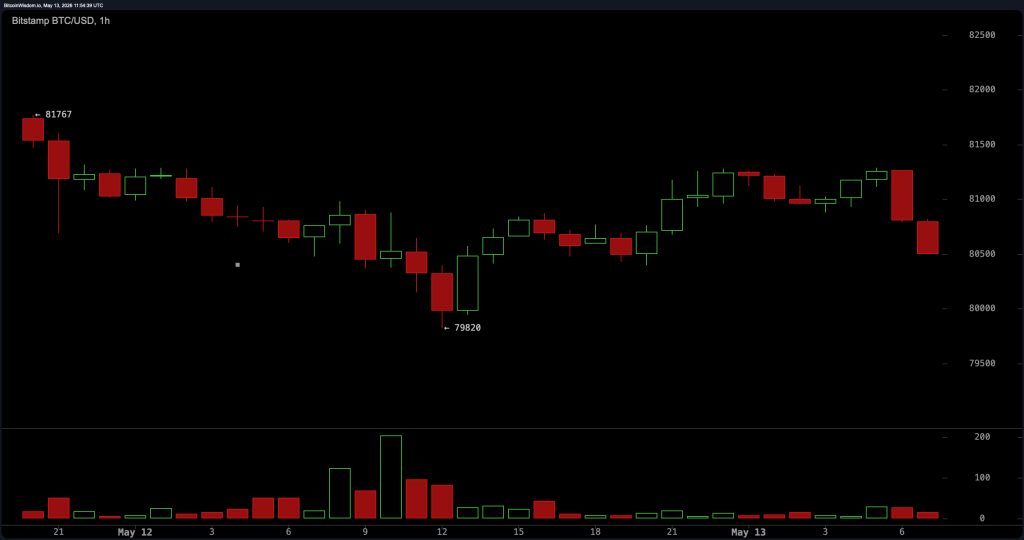
The hourly chart reflects growing short-term weakness after Bitcoin failed to maintain traction above the $81,200 level. Sellers quickly intervened and pushed the price movement back toward the $80,500 area, where the short-term exponential moving average continued to provide nearby support. Tactical opportunities remain centered around the Exponential Moving Average (EMA) 10 around $80,465, while immediate resistance remains centered between $81,000 and $81,300.
If the $80,300 level is not defended, the downward pressure towards the $79,500 area could accelerate quite quickly. At the same time, a clean break above $81,500 with increased volume would likely move sentiment back towards a continuation target near the mid-$84,000 level. But for now, Bitcoin looks more like a sports car stuck in downtown traffic than a breakout machine.
The oscillator readings show a mostly neutral situation, suggesting that Bitcoin has not yet entered extreme territory despite the recent volatility. The Relative Strength Index (RSI) recorded 60 and the stochastic reading was 76, both reflecting a state of balanced momentum rather than overheating. The Commodity Channel Index (CCI) was 69 and the Average Directionality Index (ADX) was 32, further reinforcing the market’s current indecision.
Meanwhile, Awesome Oscillator held steady at 3,593, indicating that the underlying momentum is stable. While momentum (10) remained positive at 2,223, the moving average convergence divergence (MACD) level (12, 26) turned negative at 1,774, highlighting the short-term momentum decline underlying Bitcoin’s broader bullish structure. In other words, while the market asserts itself, the indicators are essentially shrugging their shoulders.
Moving averages (MAs) continued to support the overall upside, but long-term resistance levels are still creating friction near the current price. The Exponential Moving Average (EMA) 10 was at $80,465 and the Simple Moving Average (SMA) 10 was $80,829. The EMA 20 is $79,207 and the SMA 20 is $79,165, both of which are consolidating nearby support. Moving further down, the EMA 30 reached $77,994 and the SMA 30 reached $78,095.
Long-term trend support was solid at EMA 50 at $76,404, SMA 50 at $74,594, EMA 100 at $76,716, and SMA 100 at $71,818. However, the EMA 200 at $82,003 and SMA 200 at $82,277 continued to act as overhead resistance zones that Bitcoin has yet to definitively reclaim. The overall technical indicators remain bullish, but until Bitcoin convincingly clears the $82,000 area, the market is likely to continue its back-and-forth pace like an impatient hedge fund manager waiting for the Fed to literally say something.
Bullish verdict:
Bitcoin’s higher time frame structure still favors upside as long as the support between $79,000 and $80,000 remains intact. The combination of bullish moving average consistency, rising lows since the April lows, and stable oscillator readings suggests that the market may simply be pausing before attempting further gains toward the $82,400 to $84,000 area.
Bear verdict:
Failure to reclaim the $81,000-$81,500 resistance zone could increase downside pressure in the short term, especially as depletion signals continue to flash on lower time frames, especially after the recent rally. Bitcoin’s short-term structure weakens significantly below $79,000, potentially exposing the market to a broader retracement towards the high $77,000s, and traders will soon find out whether the confidence is real or just crypto caffeine.