


Bitcoin prices were firmly above the key psychological support of $80,000 on Tuesday, with bulls now looking to regain momentum towards the $85,000 area after better-than-expected US CPI data briefly triggered volatility across risk assets.
According to data from crypto.news, Bitcoin ($BTC) was trading around $81,300 at press time on May 13, after rebounding from intraday lows around $80,400 following the release of the inflation report. After several failed breakout attempts over the past week, the bellwether asset continues to consolidate below the key $82,300 resistance zone.
Despite the market’s initial reaction, traders increasingly believe that the CPI increase was largely priced in ahead of the announcement, limiting broader downward pressure across crypto markets. Risk appetite also stabilized as investors shifted focus to future US crypto regulatory developments, particularly the proposed Clarity Act, which many market participants see as the next major catalyst for institutional adoption and regulatory certainty.
At the same time, on-chain sentiment continues to improve despite recent volatility. Analysts at CryptoQuant recently noted that their proprietary market cycle signals pushed Bitcoin into early bull market territory for the first time since March 2023, suggesting that long-term momentum could still drive upside despite short-term consolidation.
Derivatives positioning shows that traders continue to hold tight to the $80,000 support area. CoinGlass liquidation heatmap data reveals that a large cluster of leveraged liquidation liquidity is concentrated between approximately $84,000 and $85,500, while another dense pocket of liquidity forms just below the $80,000 mark.
Such liquidity zones often act as magnets for short-term price movements, as market makers look for areas of concentrated leverage.
Meanwhile, broad macro sentiment is showing signs of stabilization after the latest inflation statistics failed to trigger a sustained decline across stock and crypto markets. Rather than reacting aggressively to a single CPI announcement, traders appear increasingly focused on whether the Fed will maintain its current policy stance.
Bitcoin price analysis
On the daily chart, Bitcoin continues to trade within a broad ascending channel structure that has remained in place since late March, with buyers repeatedly stepping near lower trendline support.
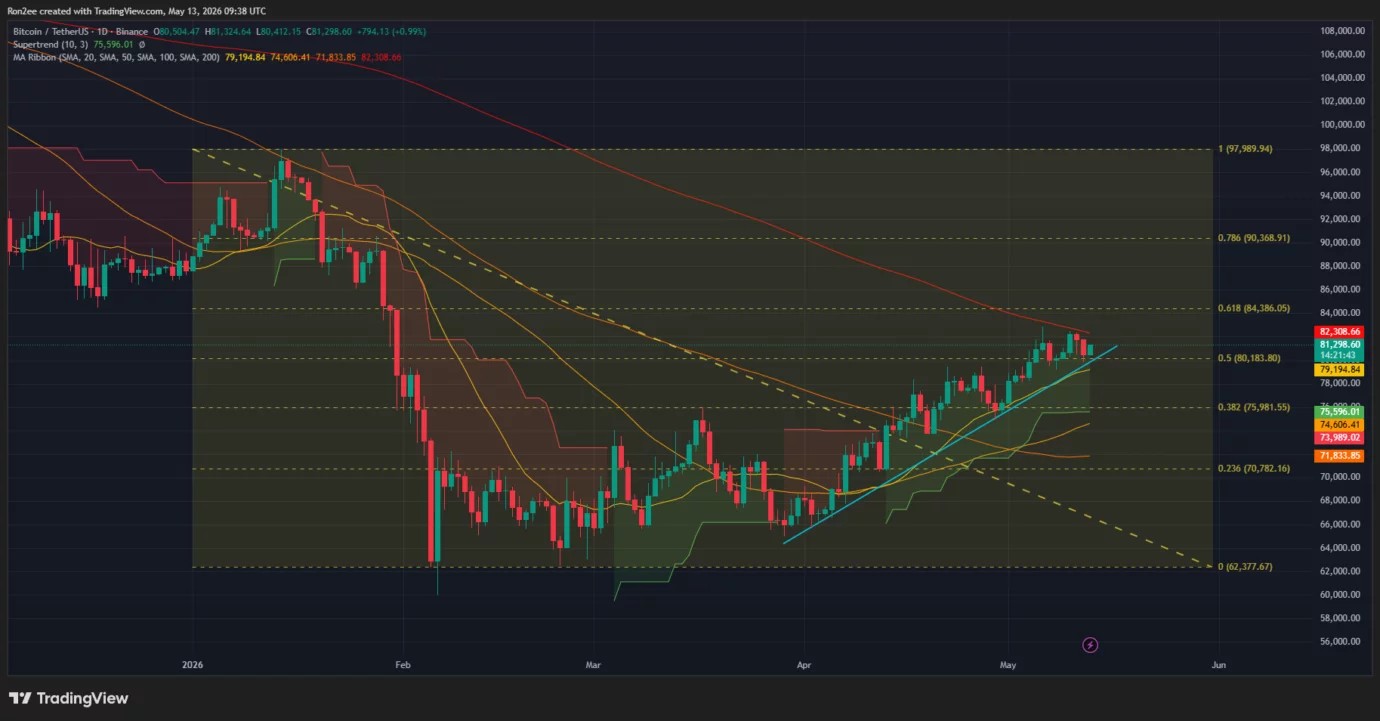
$BTC It has recently bounced around the 0.5 Fibonacci retracement level near $80,180, which continues to serve as an important short-term support zone. The recent rally suggests that the bulls are still defending the broad high-low structure despite losing momentum in recent trades.
Bitcoin also remains above its 20-day, 50-day, and 100-day simple moving averages, but the supertrend indicator continues to hold in bullish territory around $75,500, indicating that the broader trend structure remains constructive.
However, the 200-day SMA near $82,300 continues to act as an overhead resistance level for the time being, and has repeatedly curtailed upside attempts over the past few sessions.
Momentum indicators suggest that the bullish pressure has cooled slightly but has not completely reversed. Although the histogram has flattened significantly, the MACD is still in positive territory, indicating that upward momentum may temporarily slow as the market breaks below resistance.
If the bulls can bravely reclaim the $82,300 area, Bitcoin could target the next major resistance near the 0.618 Fibonacci level around $84,380, followed by a broader liquidation cluster around $85,000-$85,500.
On the downside, failure to sustain above the $80,000 psychological support zone could weaken the uptrend and increase risk. $BTC Further downside room opens towards the $76,000 area, where the 100-day SMA and lower channel support currently converge.