


Bitcoin is trading at $75,213 on April 20, 2026 at 8:00 AM ET, staying within a defined range as the broader bullish structure remains intact. Technical signals across multiple time frames suggest the market is in transition, balancing near-term indecision against a still favorable macro trend.
Important points:
- Bitcoin holds $75,213 as of April 20, 2026. The consolidation indicates a neutral impact on the market around $76,000.
- The data shows that the 10/15 moving average is bullish. The upside is soon resting on the $76,000 breakout.
- Bitcoin oscillator mixed with MACD at 1,630. The next move depends on holding support at $74,000.
Bitcoin chart outlook
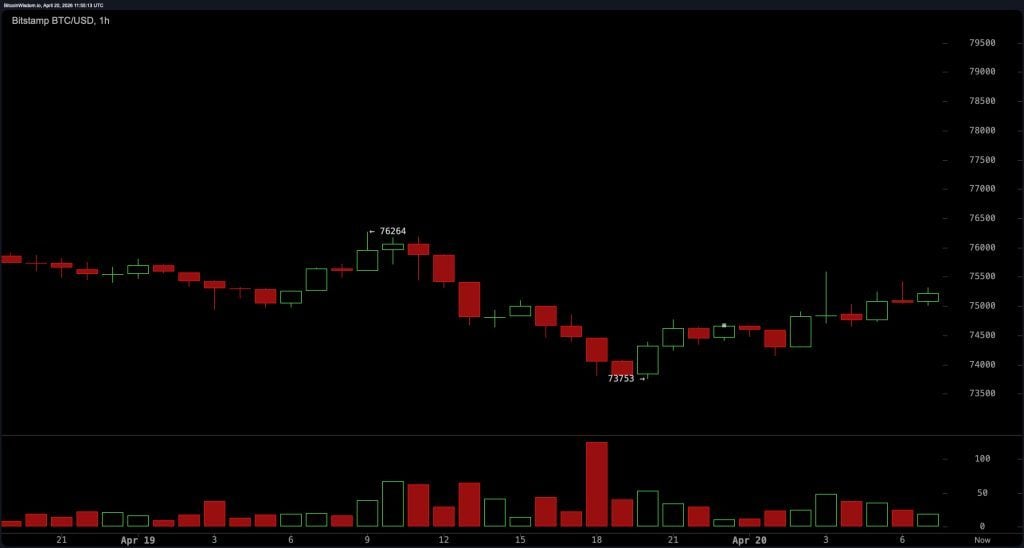
Bitcoin’s hourly chart reflects a range-bound structure with early signs of recovery after a bounce around the $73,700 level. The price movement is forming lows, indicating increased buying interest, but subdued volume lacks confidence in momentum. Immediate support has been established around $74,000, but resistance remains solid between $75,500 and $76,000. This tight integration suggests short-term equilibrium between buyers and sellers.
From an execution perspective, a one-hour time frame favors tactical positioning over directional certainty. The lack of significant volume expansion means that breakout attempts may be unsustainable unless accompanied by an increase in participants. Bitcoin traders monitoring this time frame will likely view a confirmed move above $76,000 as a potential trigger for a bullish continuation, but repeated rejections in that zone reinforce the prevailing range-bound environment.
On the 4-hour Bitcoin chart, the structure shows a transition from bullish momentum to a sideways consolidation with a slight bearish drift. Bitcoin price has been unable to sustain levels near $78,000 and has formed a low that indicates short-term momentum is weakening. Support has been identified between $73,500 and $74,000, while resistance is centered around $75,500 and $76,000. This range reflects a distribution stage where market participants are reassessing directional bias.
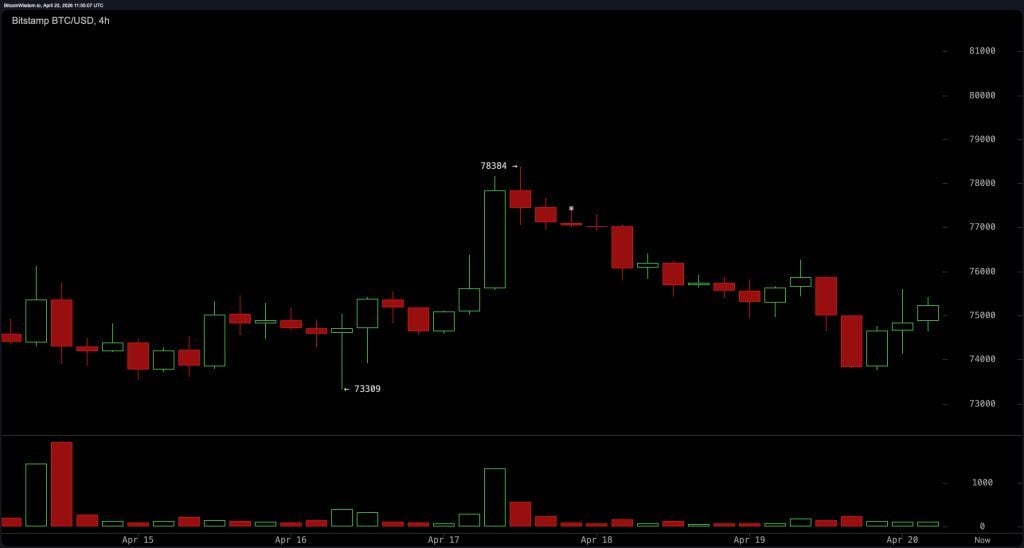
The 4-hour timeframe emphasizes a neutral to bearish momentum profile unless a definitive breakout occurs. The inability to reclaim higher resistance levels suggests that supply remains active, limiting near-term upside progress. However, the lack of active selling pressure indicates that this is more likely a consolidation rather than a solid trend reversal, in line with broader market conditions.
On the daily chart, Bitcoin maintains a clear pattern of highs and lows, confirming that the macro bullish trend remains intact. The recent move towards $78,300 was supported by increased volume confirming demand strength and a subsequent controlled return to consolidation. Major support levels are located between $72,000 and $73,000, with deeper structural support near $69,000. Resistance remains concentrated between $76,500 and $78,500.
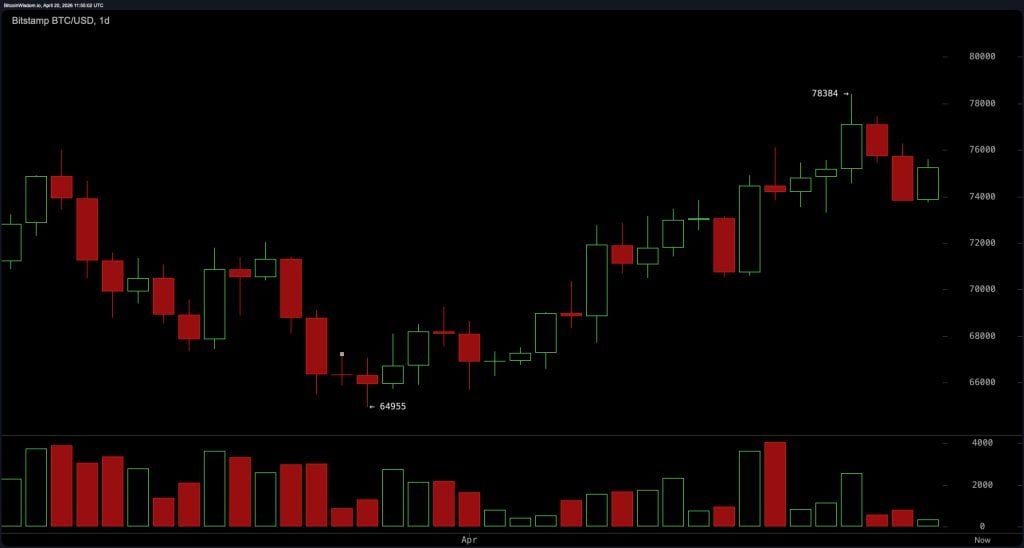
This daily structure suggests that the current price movement represents a healthy retracement within an ongoing uptrend rather than a reversal. The market appears to be weighing the decision between continuation and further adjustment. The broader bullish framework remains structurally sound as long as price remains above the $72,000 area.
The oscillator primarily presents a neutral outlook, reinforcing the consolidation narrative. The Relative Strength Index (RSI) is 59, indicating balanced momentum with no overbought conditions. The Stochastic Oscillator is reading 68 and the Commodity Channel Index (CCI) is 75, both reflecting a neutral positioning.
An average directional index (ADX) of 19 indicates weak trend strength, confirming a lack of directional confidence. However, bullish signals are emerging from the Awesome Oscillator (AO) of 4,719, Momentum (MOM) of 2,266, and Moving Average Convergence Divergence (MACD) of 1,630, all pointing to underlying upward pressure.
The moving average (MA) indicates mostly buy conditions, further supporting a cautious bullish bias. Short- to medium-term indicators such as Exponential Moving Average (EMA) 10 at 74,255, Simple Moving Average (SMA) 10 at 74,437, EMA 20 at 72,827, and SMA 20 at 71,964 all support the upward momentum. Similarly, EMA 30, SMA 30, EMA 50, and SMA 50 will also continue to support. However, long-term resistance is evident, with the EMA 100 suggesting a sell at 75,276, the EMA 200 at 82,757, and the SMA 200 at 86,330, both indicating broader overhead pressure.
Bullish verdict:
If the breakout is confirmed and sustains above the $76,000 resistance zone, it will validate the bullish continuation within the established daily uptrend. This scenario is supported by a broader pattern of highs and lows, along with buy signals from key indicators such as Moving Average Convergence Divergence (MACD), Momentum (MOM), and Awesome Oscillator (AO). Strength across the short-term and intermediate-term moving averages, including Exponential Moving Averages (EMAs) 10, 20, 30, and 50, strengthens the upside potential, targeting a retest of the $78,000 to $78,500 resistance band with room for further expansion if volume confirms the move.
Bear verdict:
A repeated rejection within the $75,500-$76,000 resistance zone followed by a break below the $74,000 support would signal short-term bearish control, paving the way for the $73,000 level, with downside risk increasing to $70,000-$69,000 if selling pressure accelerates. This result is consistent with weakening momentum on the 4-hour time frame, low values of the Average Directional Index (ADX) indicating weakening trend strength, and sell signals from long-term moving averages such as the Exponential Moving Average (EMA) 100 and 200. Such a move would signal a deeper correction within the broader trend.