


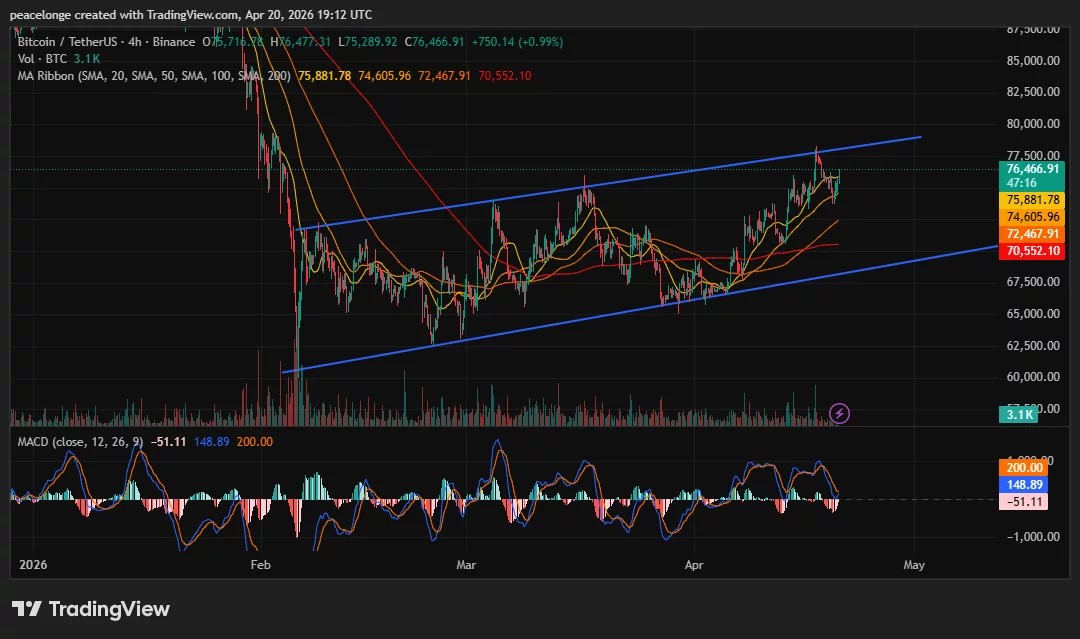
Bitcoin price on April 20th was $76,466, approaching the top of a 4-hour ascending channel from February lows, while the MACD is simultaneously showing a bearish crossover in the same time frame, creating directional tension that will define the near-term trajectory heading into the April 28th FOMC meeting.
Bitcoin ($BTC) On April 20, the price was $76,466, and the price reached the upper trend line of the ascending channel that constitutes the entire recovery from the February lows, increasing by 0.99% in the 4th hour session. The 4H MACD shows a bearish crossover at the same time, the MACD line is below the 200.00 signal at 148.89 and the histogram is recorded at -51.11. The four SMAs are still in a bullish stack below the price. SMA 20 is $75,881, SMA 50 is $74,605, SMA 100 is $72,467, and SMA 200 is $70,552. 4H volume 3.1K $BTC is modest, with no high-confidence breakouts or distribution events identified at this stage.
The ascending channel on the 4H chart connects the February low near $59,000 with the consecutive highs from March and early April, creating a well-defined upper bound that currently sits near $77,500. The CME futures market closed at $77,540 on Friday before the weekend and reopened at $74,600 on Monday, creating an upside gap of approximately 3.8%, which is acting as a short-term technical magnet for institutional positioning.
A four-hour rising channel from February lows is the dominant structural framework for Bitcoin’s current price action. Each previous touch to the upper border has been followed by a pullback to the channel midpoint or SMA ribbon, and the current test is the most significant since the channel was formed. A 4H MACD bearish crossover at this level is the signal that most directly challenges the breakout case. If the MACD line falls below the signal while the price is at a major resistance level, the technical convention is that momentum will shift towards the sellers before the breakout is confirmed on a closing price basis.
The histogram reading of -51.11 is modest compared to the 148.89 MACD and the signal reading of 200.00, suggesting an early stage deceleration rather than deep bearish momentum. Early crossovers at resistance levels that do not extend to a significantly negative histogram have historically been resolved with a retest of the resistance rather than a breakdown, as long as the ascending channel structure is maintained below the closing price base.
Analyst @ChmielDk, a trader with over 15 years of market experience and who posted his analysis on X, flagged $60,000 as a potential lower bound under the worst-case geopolitical deterioration scenario, while the $77,540 CME gap represents the main near-term technical objective, with short covering and institutional buying potentially accelerating the price towards it if the sell wall is cleared.
Key levels: support, resistance, target price
SMA 20 at $75,881 is the first 4H support on a closing price basis. A close below this removes short-term dynamic support and activates the SMA 50 of $74,605. This roughly coincides with the midpoint of the ascending channel. A sustained close below $74,605 will lead to a breakout of the midrange of the channel and focus on the lower bound near $70,552, where the SMA 200 also resides.
On the upside, the top of the channel near $77,500 will provide immediate resistance. A confirmed 4-hour close above this would open the CME gap at $77,540 as an initial target and $80,000 as an extended psychological target. According to April 17 data from Coinglass, a $450 million sell wall has been confirmed between $75,900 and $76,300, with the price currently sitting right at the top of this cluster. Clearing it with volume is a prerequisite for pushing cleanly to the upper limit of the channel.
Bullish Case Invalidated: The 4-hour close is below $74,605 due to the continued expansion of the bearish MACD histogram.
On-chain and market data context
Bitcoin open interest is $57.15 billion per coin glass, with 24-hour futures volume of $72.75 billion and $136.5 million of futures positions liquidated in the past 24 hours. The modest amount of liquidations relative to total open interest indicates that the current price is not causing a cascade in either direction. Binance’s Bitcoin funding rate has remained negative for approximately 46 days. This means that short positions are paying long positions throughout the advance of the ascending channel. A sustained negative funding rate during an uptrend indicates that short-side positions are likely to accumulate and get squeezed if the price breaks through the overhead sell wall.
Iran reinstated restrictions on the Strait of Hormuz over the weekend, effectively ending a two-week ceasefire and pushing Brent crude back above $100 a barrel. Bitcoin has fallen from Friday’s high of $78,000 as the macro risk environment strengthened again at the start of weekend trading. The FOMC meeting on April 28th and 29th is next scheduled, with CME FedWatch showing a 98% chance of keeping rates unchanged. Until the geopolitical situation subsides or the Fed reverses course, Bitcoin’s near-term ceiling will likely be determined by the interplay between the top of the ascending channel and the short positioning that has accumulated overhead.
If Bitcoin closes the 4-hour candlestick above $77,500 with increasing volume, the CME gap of $77,540 becomes an immediate target and $80,000 becomes a long-term target. If the price fails to clear $76,300 in the current session and falls below $75,881, the focus will return to the channel midpoint of the SMA 50 near $74,605.