


Bitcoin is running into resistance as the economic picture becomes more complex. With the entry of some important on-chain sellers and two big data announcements in the US, prices are rising towards $75,000. These will determine whether Bitcoin can break through $78,1 and be knocked back again.
According to Glassnode’s April 15 report, the current setup is under measurable stress. Short-term holder supply as a percentage of profits remains at 43.2%, still below the 54.2% level at which historical bear market rebounds have run out, leaving room for upside.
However, the 30-day EMA for the realized P/L ratio stands at 1.16, indicating that investors are selling more strongly than buying on the downside. BTC hit an intraday high of $75,218, with the distance to the ceiling being 5.2%.
Glassnode describes the current move as a rescue rally within an ongoing bear market structure, saying that a sustained break above $78,100 will require fresh demand that can absorb the supply of overhead that investors have been piling on during the rally.
That demand driver has yet to materialize, making the macro calendar released over the next two weeks more important than usual.

level that determines movement
Glassnode organizes its price map around three zones.
The first real test lies between $74,000 and $76,000, where clusters of short-term liquidations have piled up and the recent rally has repeatedly stalled. Bitcoin is already trading within this initial decision zone.
The primary cap is $78,100, which Glassnode defines as the true market average, i.e. the average acquisition cost of an actively traded coin, excluding losses or dormant supply.
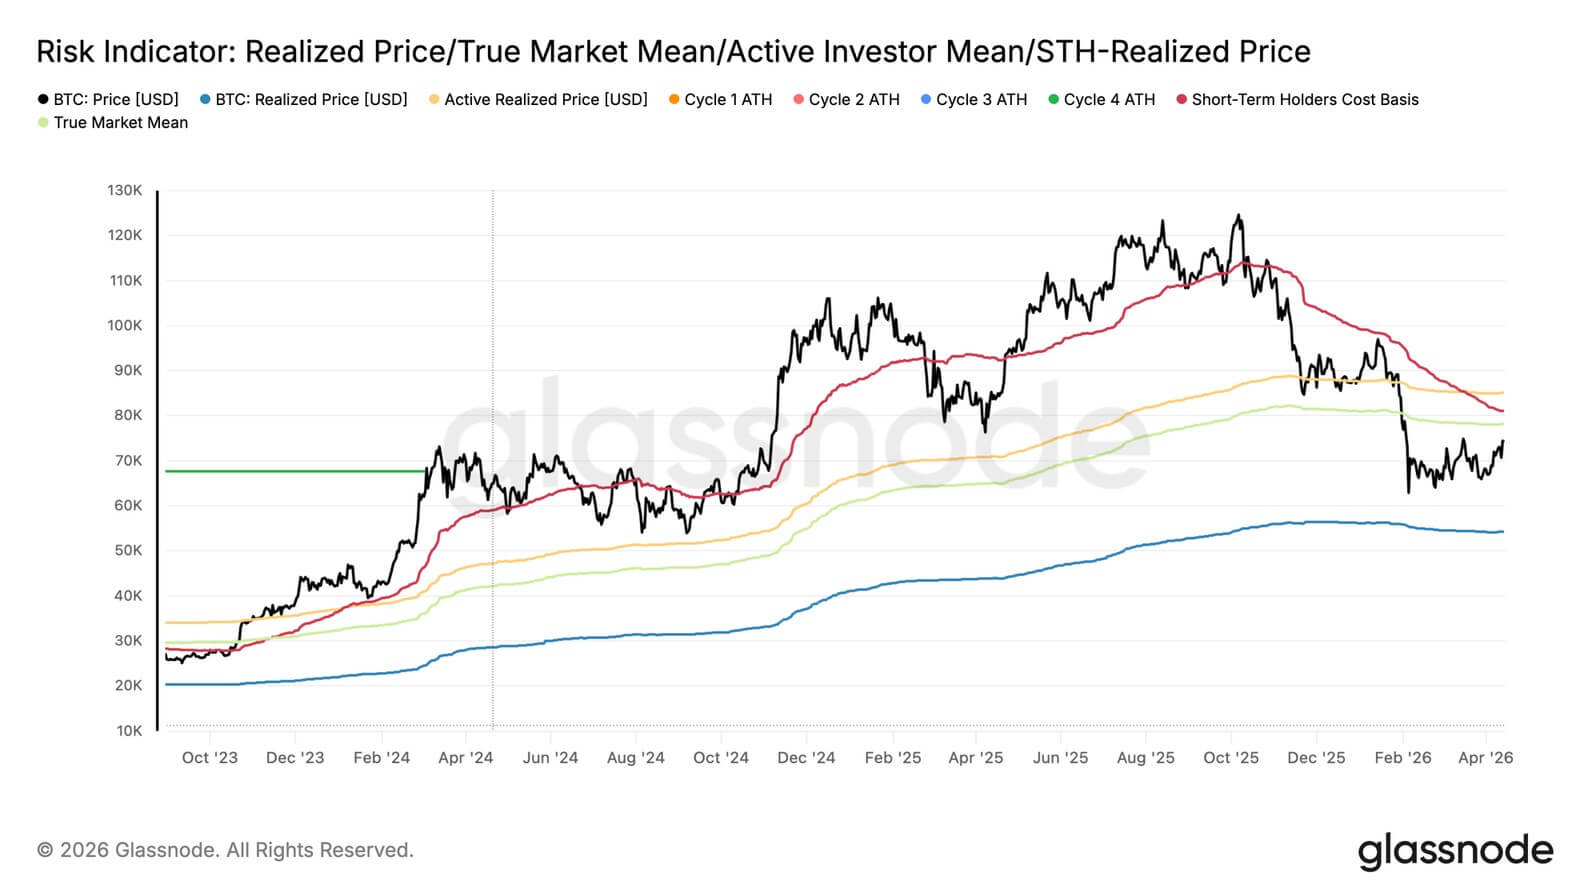
Trading below this level puts Bitcoin in what the report calls the bear market value zone, historically consistent with the market still in transition towards recovery.
A recovery and hold at $78,100 would change the tone of the rally, but another rejection there would keep the bearish structure intact.
On the downside, Glassnode has the densest liquidation cluster between $63,000 and $65,000, with the highest long-term liquidation exposure and the market absorbing repeated price probes.
Failure to break out of the $74,000-$76,000 zone would initially restart the conversation around the lower half of $60,000 as a structural reference point, although the report points to $63,000-$65,000 as a more direct support zone.
Macro backgrounds are no longer easy
An official data package in March supported the Fed’s holding claims.
The CPI increased by 3.3% compared to the same month last year, the core CPI increased by 2.6%, and the energy index increased by 10.9% compared to the same month. The PPI rose 0.5% month-on-month and 4.0% year-on-year, the number of employees increased by 178,000, and the unemployment rate remained at 4.3%.
In its March statement, the Federal Reserve made clear that uncertainty surrounding the economic outlook remains high and that the impact of geopolitical events in the Middle East on the U.S. economy is unclear.
In April, overall activity expanded at a modest to moderate pace. Still, the Middle East conflict is a source of great uncertainty, complicating hiring, pricing and capital investment decisions, and many companies are taking a wait-and-see attitude.
Energy and fuel costs rose sharply in all districts, and input cost expansion extended beyond energy.
The combination of persistent core inflation, rising geopolitical uncertainty, and corporate divestment will remove the macro tailwinds for Bitcoin to break out of the $74,000-$76,000 cluster and remain confidently above $78,100.
Macro backdrop raises the bar for Bitcoin breakout. Robust inflation data, a cautious Fed, and rising energy costs all tighten the conditions for a conviction-based rally.
The IMF’s April 2026 World Economic Outlook adds a global framework.
Under the limited conflict assumption, global growth would slow to 3.1% in 2026 and 3.2% in 2027, while global inflation would rise.
The IMF’s Global Financial Stability Report points out that since late February, stock prices have fallen while bond yields have risen as overall financial conditions have tightened due to rising energy costs and expectations for higher interest rates.
Bitcoin’s journey through on-chain resistance will go more smoothly in an easing environment than in one where risk assets are already battling tough macro pricing.
| indicator | latest reading | Why is it important for BTC? |
|---|---|---|
| CPI (YoY) | 3.3% | maintain inflationary pressure |
| Core CPI (YoY) | 2.6% | Restricting easy dovish price revisions |
| Energy index (month-on-month) | +10.9% | Strengthening inflation and geopolitical risks |
| PPI (month-on-month) | +0.5% | Signal pipeline price pressure |
| PPI (YoY) | 4.0% | Inflation background remains steady |
| Payroll calculation | +178,000 | The labor market remains |
| unemployment | 4.3% | Favors Fed prudence over urgency of easing |
| IMF global growth rate 2026 | 3.1% | Against the backdrop of slowing global economic growth |
| IMF global growth rate 2027 | 3.2% | Recovery remains subdued |
| financial situation | Tightening from late February | Tough background for risk assets |
What the derivative reading adds
Spot Cumulative Volume Delta (CVD) has improved, but Binance-led purchases have outpaced Coinbase, indicating stronger offshore and retail participation than institutional follow-through.
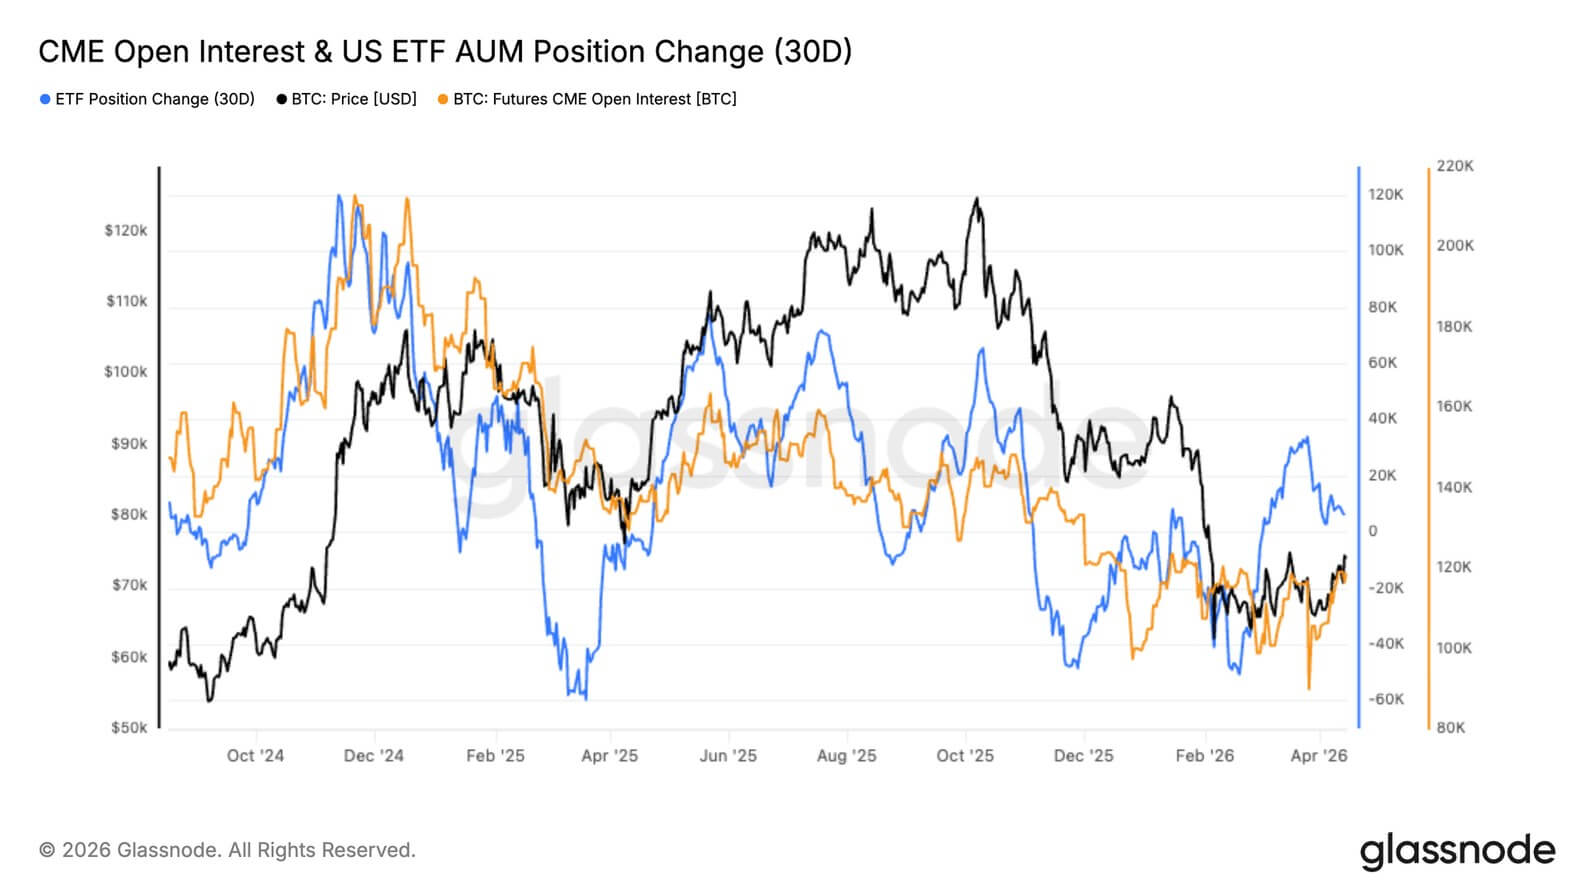
CME open interest and US ETF assets under management have begun to recover, but both remain below their previous highs, consistent with cautious re-engagement.
The option has a one-month implied volatility of approximately 42.6%, a 25 delta skew tilted toward the put, and a one-week volatility risk premium of around -2 volume points, indicating that realized volatility exceeds implied volatility. These points illustrate the structure of pricing the defensive market in wait mode.
Glassnode also points out that a large pocket of negative gamma is located near the $75,000 strike, and market makers appear to be structurally shorting calls at that level.
As the spot approaches, hedging flows will become stronger, potentially amplifying the upside price movement. However, the mechanics explain the mechanical characteristics of short covering.
Two futures for this setup
Bitcoin is testing its resilience as two of the most important macro checkpoints in the short term arrive.
The Census Bureau’s March Pre-Monthly Retail Report is scheduled to be released on April 21st. The next FOMC decision will be made on April 28-29. Retail sales will be the clearest indicator in the short term of whether consumer demand is holding steady or softening amid rising energy costs and geopolitical uncertainty.
The FOMC is likely to confirm or complicate the Fed’s current wait-and-see stance.
Weaker retail data or the Fed’s outlook easing yield expectations would provide macro cover for Bitcoin to cleanly break out of the $74,000-$76,000 cluster.
A hotter or more complex reading would impact distribution activity, which is already confirmed with a realized P&L ratio of 1.16.
In the bull case, the on-chain lever and macro lever must be pulled in the same direction. Bitcoin clears the $74,000-$76,000 short-term liquidation cluster, builds sufficient spot demand as ETF coverage widens, CME participation accelerates, and Coinbase activity turns decisively positive to absorb profit realizations already underway.
Macro readings from the FOMC easing retail sales and interest rate expectations will provide the external catalyst the Glassnode framework requires.
If these conditions converge, $78,100 will be the level at which the rally will actively challenge, and a close above it will redefine the nature of the rally.
Glassnode says the potential for spikes toward or above the true market average remains substantial over the medium term.
| scenario | What happens on-chain | What the macro needs to do | Impact on price |
|---|---|---|---|
| bull case | BTC clears $74,000-76,000, spot demand grows, ETF/CME/Coinbase participation improves | Softening retail sales or Fed result in moderating yield expectations | $78.1,000 is disputed and may be recovered. |
| bear case | BTC fails at $74,000-76,000, profit-taking continues, rally continues to be squeezed | Financial conditions are tight due to strong retail sales or hawkish reading from the Fed | Focus is on the low $60,000s, then back to $63,000-$65,000 |
| keytel | Demand absorbs indirect supply | Macro gives room to risk assets | Rally will change character only if resistance is exceeded |
The bearish case occurs when macro frictions occur before demand occurs. Risk assets could face another sell-off if retail sales strengthen or the FOMC is more hawkish than expected.
Bitcoin fails again in the $74,000-$76,000 zone, the realized P&L rises, and the downside focus returns to the initial reference point of the low $60,000 region and the support zone of $63,000-$65,000 backed by a deeper liquidation.
This result is consistent with Glassnode’s framework that the current structure is a bear market rebound, with the medium- to long-term bias remaining tilted to the downside until Bitcoin regains its short-term holder cost base of $81,600.
(Tag translation) Bitcoin