


Ethereum is trading at $2,255.04, up 7.09% on the monthly chart, after testing the monthly low of $2,017.09 in April 2026 and maintaining an ascending support trend line connecting Ethereum’s major lows since 2019. The monthly MACD histogram turned positive at 129.89, the first constructive macro momentum signal since the decline from late 2025. Peak price is $4,800.
Ethereum ($ETH) Price tested and held the monthly low of $2,017.09 at $2,255.04 in April 2026, then held the rising support trendline annotated on the chart connecting Ethereum’s lows from the 2019 base to the current cycle. Both SMAs remain overhead. The SMA 50 at $2,440.86 is the closest resistance, and the SMA 20 at $2,857.71 is further above. The monthly candlestick for April depicts a long bottom wick on the trend line, a candlestick structure that historically indicates absorption demand at a structurally important level.
The rising support trend line on the monthly chart connects Ethereum’s 2019 bear market low, 2020’s pre-rise base, and 2022 cycle bottom, making this the deepest and most tested structural level in Ethereum’s price history. The monthly wick of $2,017.09 is the most important test of the trend line in the current correction, with the monthly close holding below it. The price then recovered to the $2,255 area and formed a monthly positive entity above the trend line.
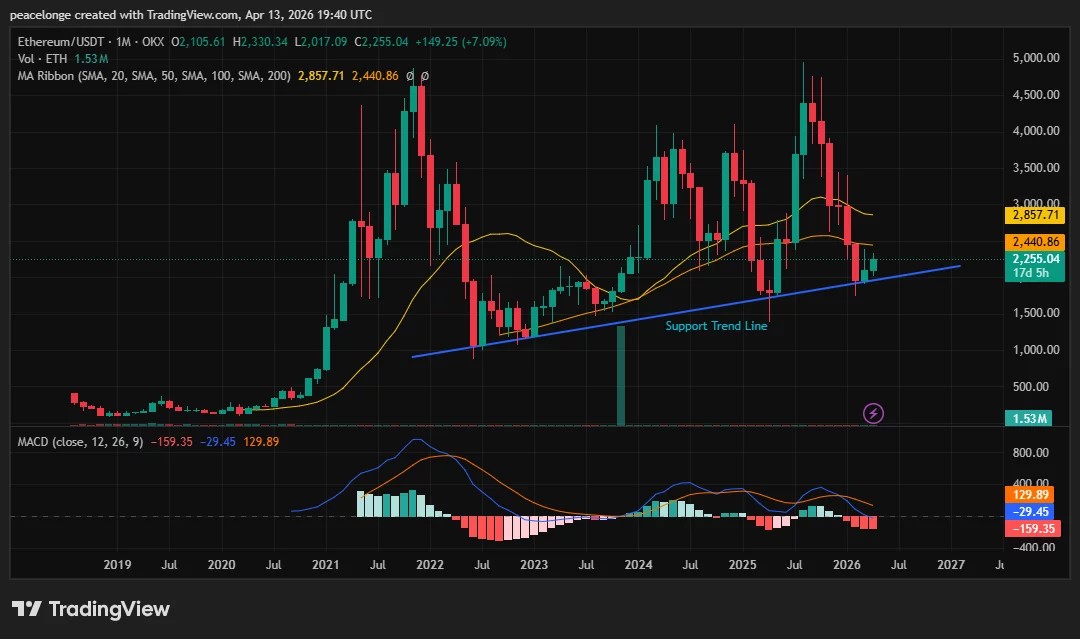
The monthly MACD (12,26,9) provides an important secondary signal. The MACD line at -29.45 is 129.89 points above the signal at -159.35, producing a positive histogram. Both lines are still in negative territory, indicating that the macro trend has not reversed, but the histogram turning positive in a multi-year trend line test is consistent with a change in momentum before the price changes on a longer time frame. This is the first positive monthly histogram since Ethereum’s decline accelerated from its August 2025 high around $4,800.
Crypto analyst Leshka writes about X: $ETH “It’s going to triple to quadruple over the next six months,” he said, pointing to the tight supply occurring on centralized exchanges as evidence that a structural foundation is forming at the trendline level, a view that now has more technical basis as the monthly MACD confirms improved momentum.
Key levels: support, resistance, target price
The multi-year uptrend line currently intersecting around $2,000 to $2,100 is the structural floor on a monthly closing price basis. The monthly low of $2,017.09 is the specific level to hold. A monthly close below this would break the trend line and expose $1,500, which coincides with the 2023 accumulation zone and represents the last major demand area before entering untested territory.
On the upside, the SMA 50 of $2,440.86 is the immediate recovery target. Once the monthly close is above that, the SMA ribbon shifts from being completely bearish and begins to regain its moving average structure. The SMA 20 of $2,857.71 is an expansion target and represents a return to the point where both SMAs converged before the 2025 collapse.
Disabled: Monthly closing price less than $2,017.
On-chain and market data context
Ethereum perpetual futures are showing a slightly positive funding rate as of April 12th, indicating that measured but persistent long-side demand is returning. Ethereum Foundation stakes 45,000 $ETH On April 5th, we approached our goal of 70,000 people. $ETHgenerates an estimated annual yield of $3.9 million to $5.4 million while reducing immediate cyclical selling pressure. More than 120,000 whales withdrawn $ETH According to CryptoQuant contributor Arab Chain, outflows from centralized exchanges in early March were the largest outflows since October 2025, a pattern consistent with accumulation near structural support.
Upgrade pipeline provides forward catalyst
Ethereum’s Gramsterdam upgrade, scheduled for the first half of 2026, aims to significantly increase gas limits, parallel transaction execution, and separation of proposers and builders. This upgrade continues the scalability work started by the Fusaka hard fork, and is expected to significantly reduce layer 2 transaction costs and strengthen the base case. $ETH At current prices.
If Ethereum holds its multi-year trendline on a monthly close basis and the MACD histogram continues to widen, the SMA 50 at $2,440 would be the first recovery target, with an extended bull case being the SMA 20 at $2,857. If the monthly closing price falls below $2,017, it will break the trend line and the macro structure will shift bearish.