


Ethereum continues to navigate a fragile market structure as price volatility compresses around key decision zones. Despite stabilizing above recent key psychological levels, the asset remains under broad bearish pressure.
Market participants are now closely monitoring whether Ethereum can reclaim the higher resistance zone or extend its downward trajectory. This stage reflects the delicate balance between weakening bearish momentum and lack of strong bullish conviction, setting the stage for a decisive breakout.
Bearish structure persists despite consolidation
Ethereum is still trading within a clear downtrend defined by falling highs and falling lows. Earlier this year, the price broke through a major support, sparking an aggressive sell-off. As a result, the bearish momentum strengthened and pushed up $ETH Entering a long period of correction.
However, price trends have been flat since March. This price range between $2,100 and $2,300 represents a temporary equilibrium. Additionally, repeated rejections around $2,300 highlight strong overhead resistance.
Technical indicators further support this cautious outlook. Prices remain below the major moving averages, and any upside attempts remain subdued.
Additionally, the Bollinger Bands are tightening, suggesting that volatility may soon increase. RSI levels are hovering near neutrality, reflecting indecision among traders.
Key levels define next moves
Support levels remain important in determining the next direction for Ethereum. Currently, the $2,150 to $2,100 zone serves as the immediate base. A drop below $2,050 could accelerate losses towards $1,900 and even $1,750.
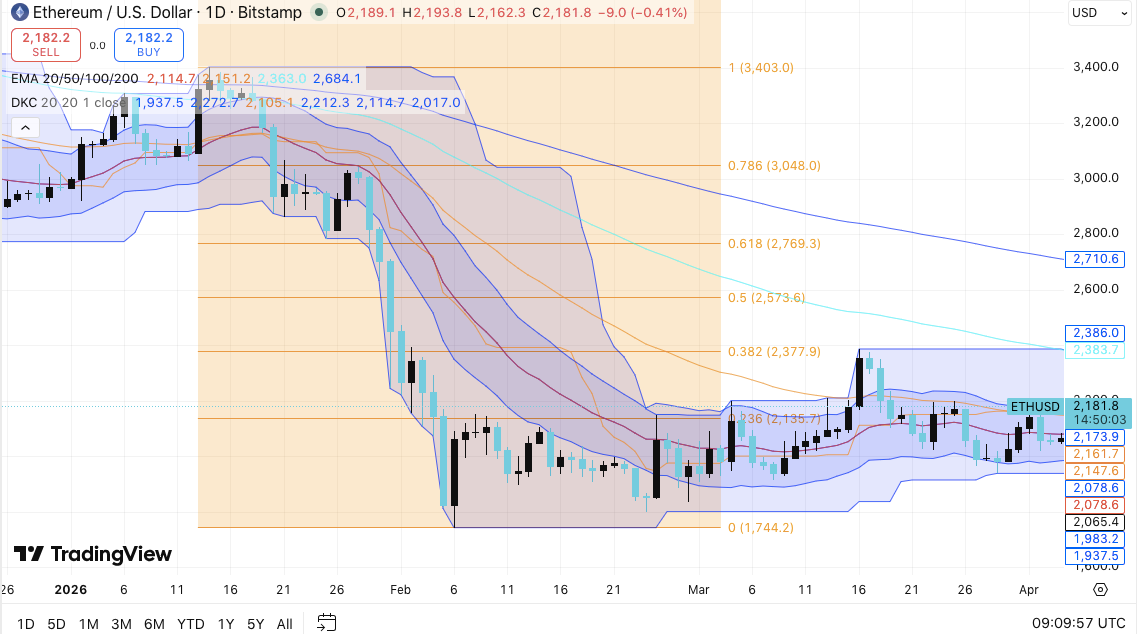
On the upside, resistance between $2,300 and $2,380 remains a major barrier. A successful breakout of this range could change near-term sentiment.
Related: $XRP Price prediction: $XRP Bullseye $1.35 Hit Wedge Apex as Breakout Trigger
As a result, the price could target $2,570 and move closer to the $2,770-$3,000 zone thereafter. Therefore, Ethereum is at a critical tipping point where either buyers or sellers are in control.
Derivatives and flows suggest cautious sentiment
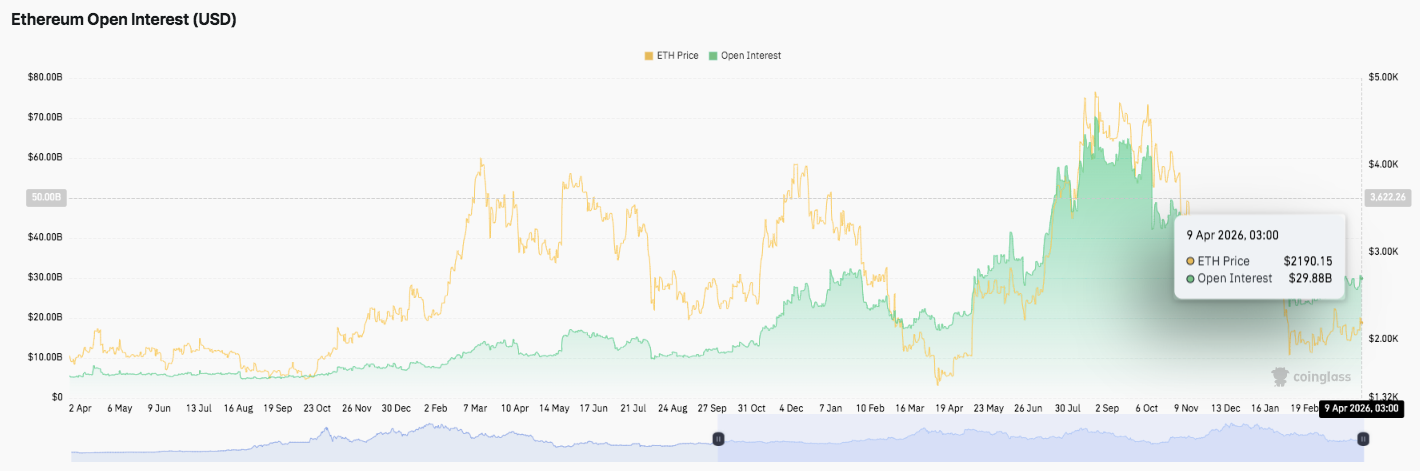
Open interest data shows long-term growth with periodic spikes as prices rise. These spikes often precede sharp corrections and indicate overleverage. Recently, open interest has cooled after reaching high levels, suggesting less speculative pressure.
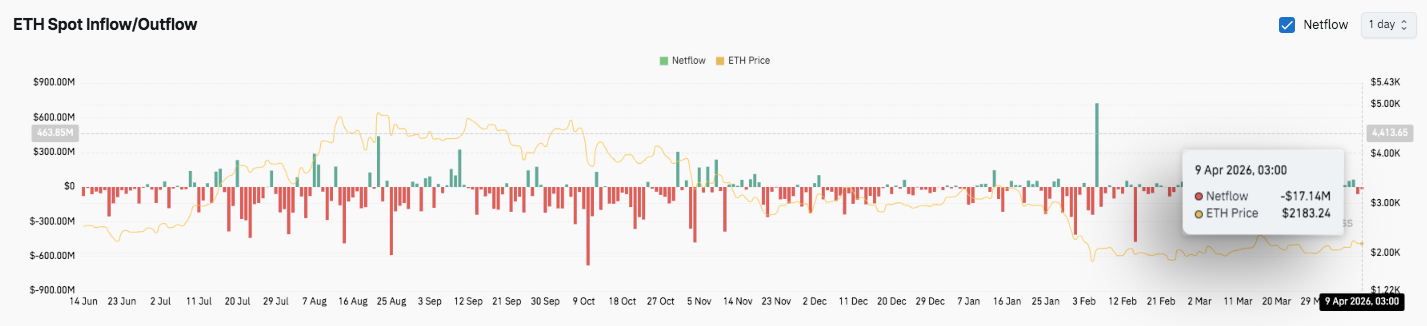
Furthermore, exchange flow data reveals that consistent net outflows dominate the trend. This pattern suggests that investors continue to reduce their exposure or move assets out of exchanges. We have seen occasional inflows during short-term recoveries, but they have been inconsistent.
Treasury moves increase market dynamics
Additionally, the Ethereum Foundation has introduced notable supply-side developments. The organization plans to convert 5,000 people $ETH It will be converted into a stablecoin for operating funds. The move aims to balance financial stability with minimal disruption to markets.
1/ Today, Ethereum Foundation converts 5000 $ETH It will be converted into a stablecoin via @CoWSwap’s TWAP functionality as part of our ongoing efforts to fund research and development, grants, and donations.
— Ethereum Foundation (@ethereumfndn) April 8, 2026
The Foundation executes trades using a time-weighted strategy, which spreads out trades over time. This approach reduces slippage and avoids sudden price shocks. Additionally, this reflects a shift towards more structured financial management within the ecosystem.
Ethereum technical outlook ($ETH) price
Ethereum price remains in a critical decision zone as it holds value after a sharp decline. Key levels are clearly defined for mid-April.
Top level: Immediate resistance is at $2,300-2,380, followed by mid-term targets at $2,570 and $2,770-3,050. A definitive breakout above $2,380 could signal a transition to bullish momentum.
Lower price level: A support cluster from $2,150 to $2,100 serves as the current consolidation base, with deeper support from $2,050 to $2,000. A further breakout could extend to $1,750-$1,740, reinforcing the broader bearish trend.
Upper limit of resistance: The $2,380 to $2,570 area is a key zone for reversal as bullish pressure persists, with the moving average near $2,300 to $2,380 providing further overhead resistance.
The technical pictures are as follows $ETH It can be compacted within a narrow area and form a short-term accumulation zone. This compression suggests that a breakout could result in significant volatility expansion in either direction.
Will Ethereum recover or extend its downtrend?
Ethereum’s near-term trajectory depends on defending the $2,100 to $2,150 support range. With continued purchases at this level, $ETH It will challenge resistance between $2,300 and $2,380. If buyers gain momentum, $ETH You might target $2,570 or even $2,770 to $3,000.
However, failure to sustain $2,100 could accelerate downside pressure, with $2,000 and $1,750 emerging as the next potential support zones. Market flows and derivatives positioning indicate cautious sentiment, with rising open interest indicating both participation and sharp liquidation risks.
Related: Solana Price Prediction: SOL price remains range-bound as bulls aim for $92 break
For now, Ethereum remains at a critical juncture. Price compression, combined with broader market trends, suggests more volatility ahead. Traders will likely keep a close eye on $2,100 to $2,380. $ETH Resume the downtrend or initiate a bullish reversal.