


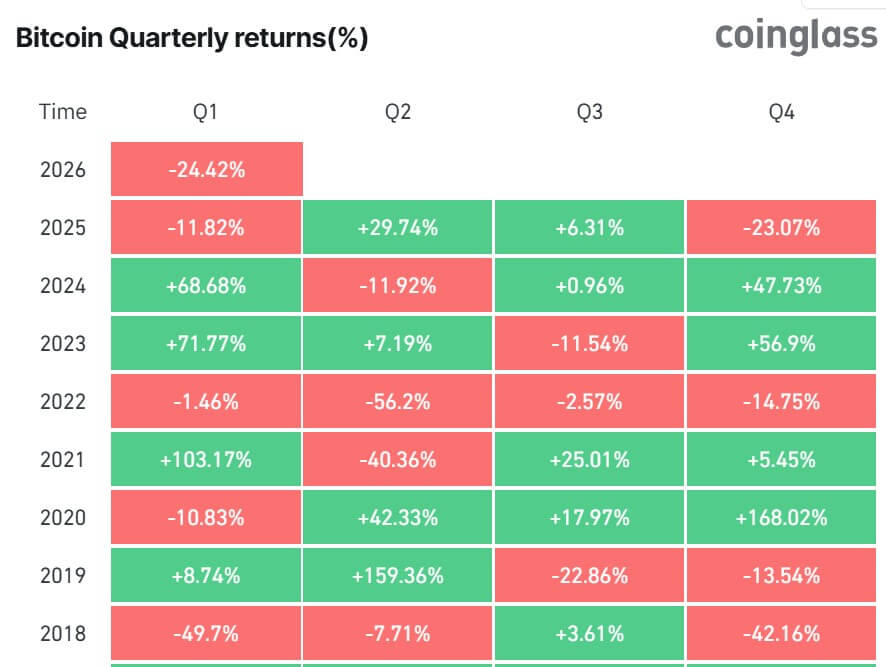
As the first quarter of 2026 concludes, Bitcoin’s slump looks more like a product of a market that has spent the past few months under increasing macro and geopolitical pressures than a breakout specific to a single cryptocurrency.
At the end of the first quarter on March 31st, Bitcoin was trading around $66,280, down about 24% since the start of the year, while the S&P 500 index was also on track for its worst quarter since 2022 as investors exited risky assets.
The quarter began with hopes that the ETF era, corporate bond purchases, and a friendly US policy backdrop would continue to give cryptocurrencies the upper hand.
But it ended with oil prices above $100 and yields rising, leaving the market once again questioning whether Bitcoin behaves like a hedge or a leveraged macro trade.
During the reporting period, the decline in BTC did not come from a single source. Rather, the poor price performance was caused by the war-induced energy shock, waning confidence in Federal Reserve easing, slowing institutional demand, routine miner sales, selective risk aversion by older holders, and defensive positioning of derivatives, all of which affected the tone of the quarter.
By late March, some of the strongest selling pressure had eased, but the market still lacked the broad, aggressive buying that typically defines a sustained recovery.
War, oil and yields reset quarter
While macroeconomic pressures shaped Bitcoin during the first three months of the year, the decisive shift came in February, when military tensions between the US, Israel, and Iran began, forcing investors to reassess inflation, interest rates, and risk exposure all at once.
Brent crude has been trading consistently above $100, with oil prices soaring as investors price in the possibility of wider disruption across the Middle East as a result of the war and warnings that prolonged disruption in the Strait of Hormuz could push prices higher.
This added to pressure on global markets already suffering from uneven growth and persistent inflation concerns.
Market analysts said the energy move had a direct impact on interest rate markets, and investors who had hoped for a friendlier policy path from the start of the year instead faced the possibility of sticky inflation from rising fuel costs, complicating the Federal Reserve’s next steps.
As a result, the 10-year Treasury yield briefly approached 4.50%, then eased. This reflects increased re-factoring in interest rate expectations as markets adjust to a less uncertain financial outlook.
On the other hand, stock prices fell as price revisions became more widespread. According to Reuters, the S&P 500 index is expected to fall about 7% in the quarter, its weakest quarterly performance in four years.
Bitcoin traded within the same macro regime. Meanwhile, geopolitical turmoil and growing distrust of traditional markets have driven the case for alternative stores of value, such as high-end cryptocurrencies.
Meanwhile, rising U.S. Treasury yields and increased demand for traditional safe-haven assets have drained liquidity from speculative positions, weighing on digital assets.
As a result, the market was trapped between approximately $60,000 and $72,000, with neither bulls nor bears able to establish a sustained trend.
This quarter ultimately demonstrated how geopolitical conflicts can quickly reshape the terms of crypto trading. A year that began with hopes of easing financial conditions has become a period defined by war risks, energy shocks and a more complex interest rate outlook, with Bitcoin and the broader digital asset market trading amid a broader global risk reset.
ETFs and institutional bidding no longer act as shock absorbers
Institutional demand remained in the market in the first quarter, but was no longer strong enough to counter the broader macro pressures driving prices lower.
Bitcoin ETFs recorded $1.8 billion in net outflows in the first two months of this year, followed by nearly $1 billion in inflows in March, according to SoSoValue data.
This brought net outflows for nine products to over $800 million in the quarter. This indicates that accumulation is not strong enough to provide stable support amid weakening spot flows and deteriorating risk sentiment.
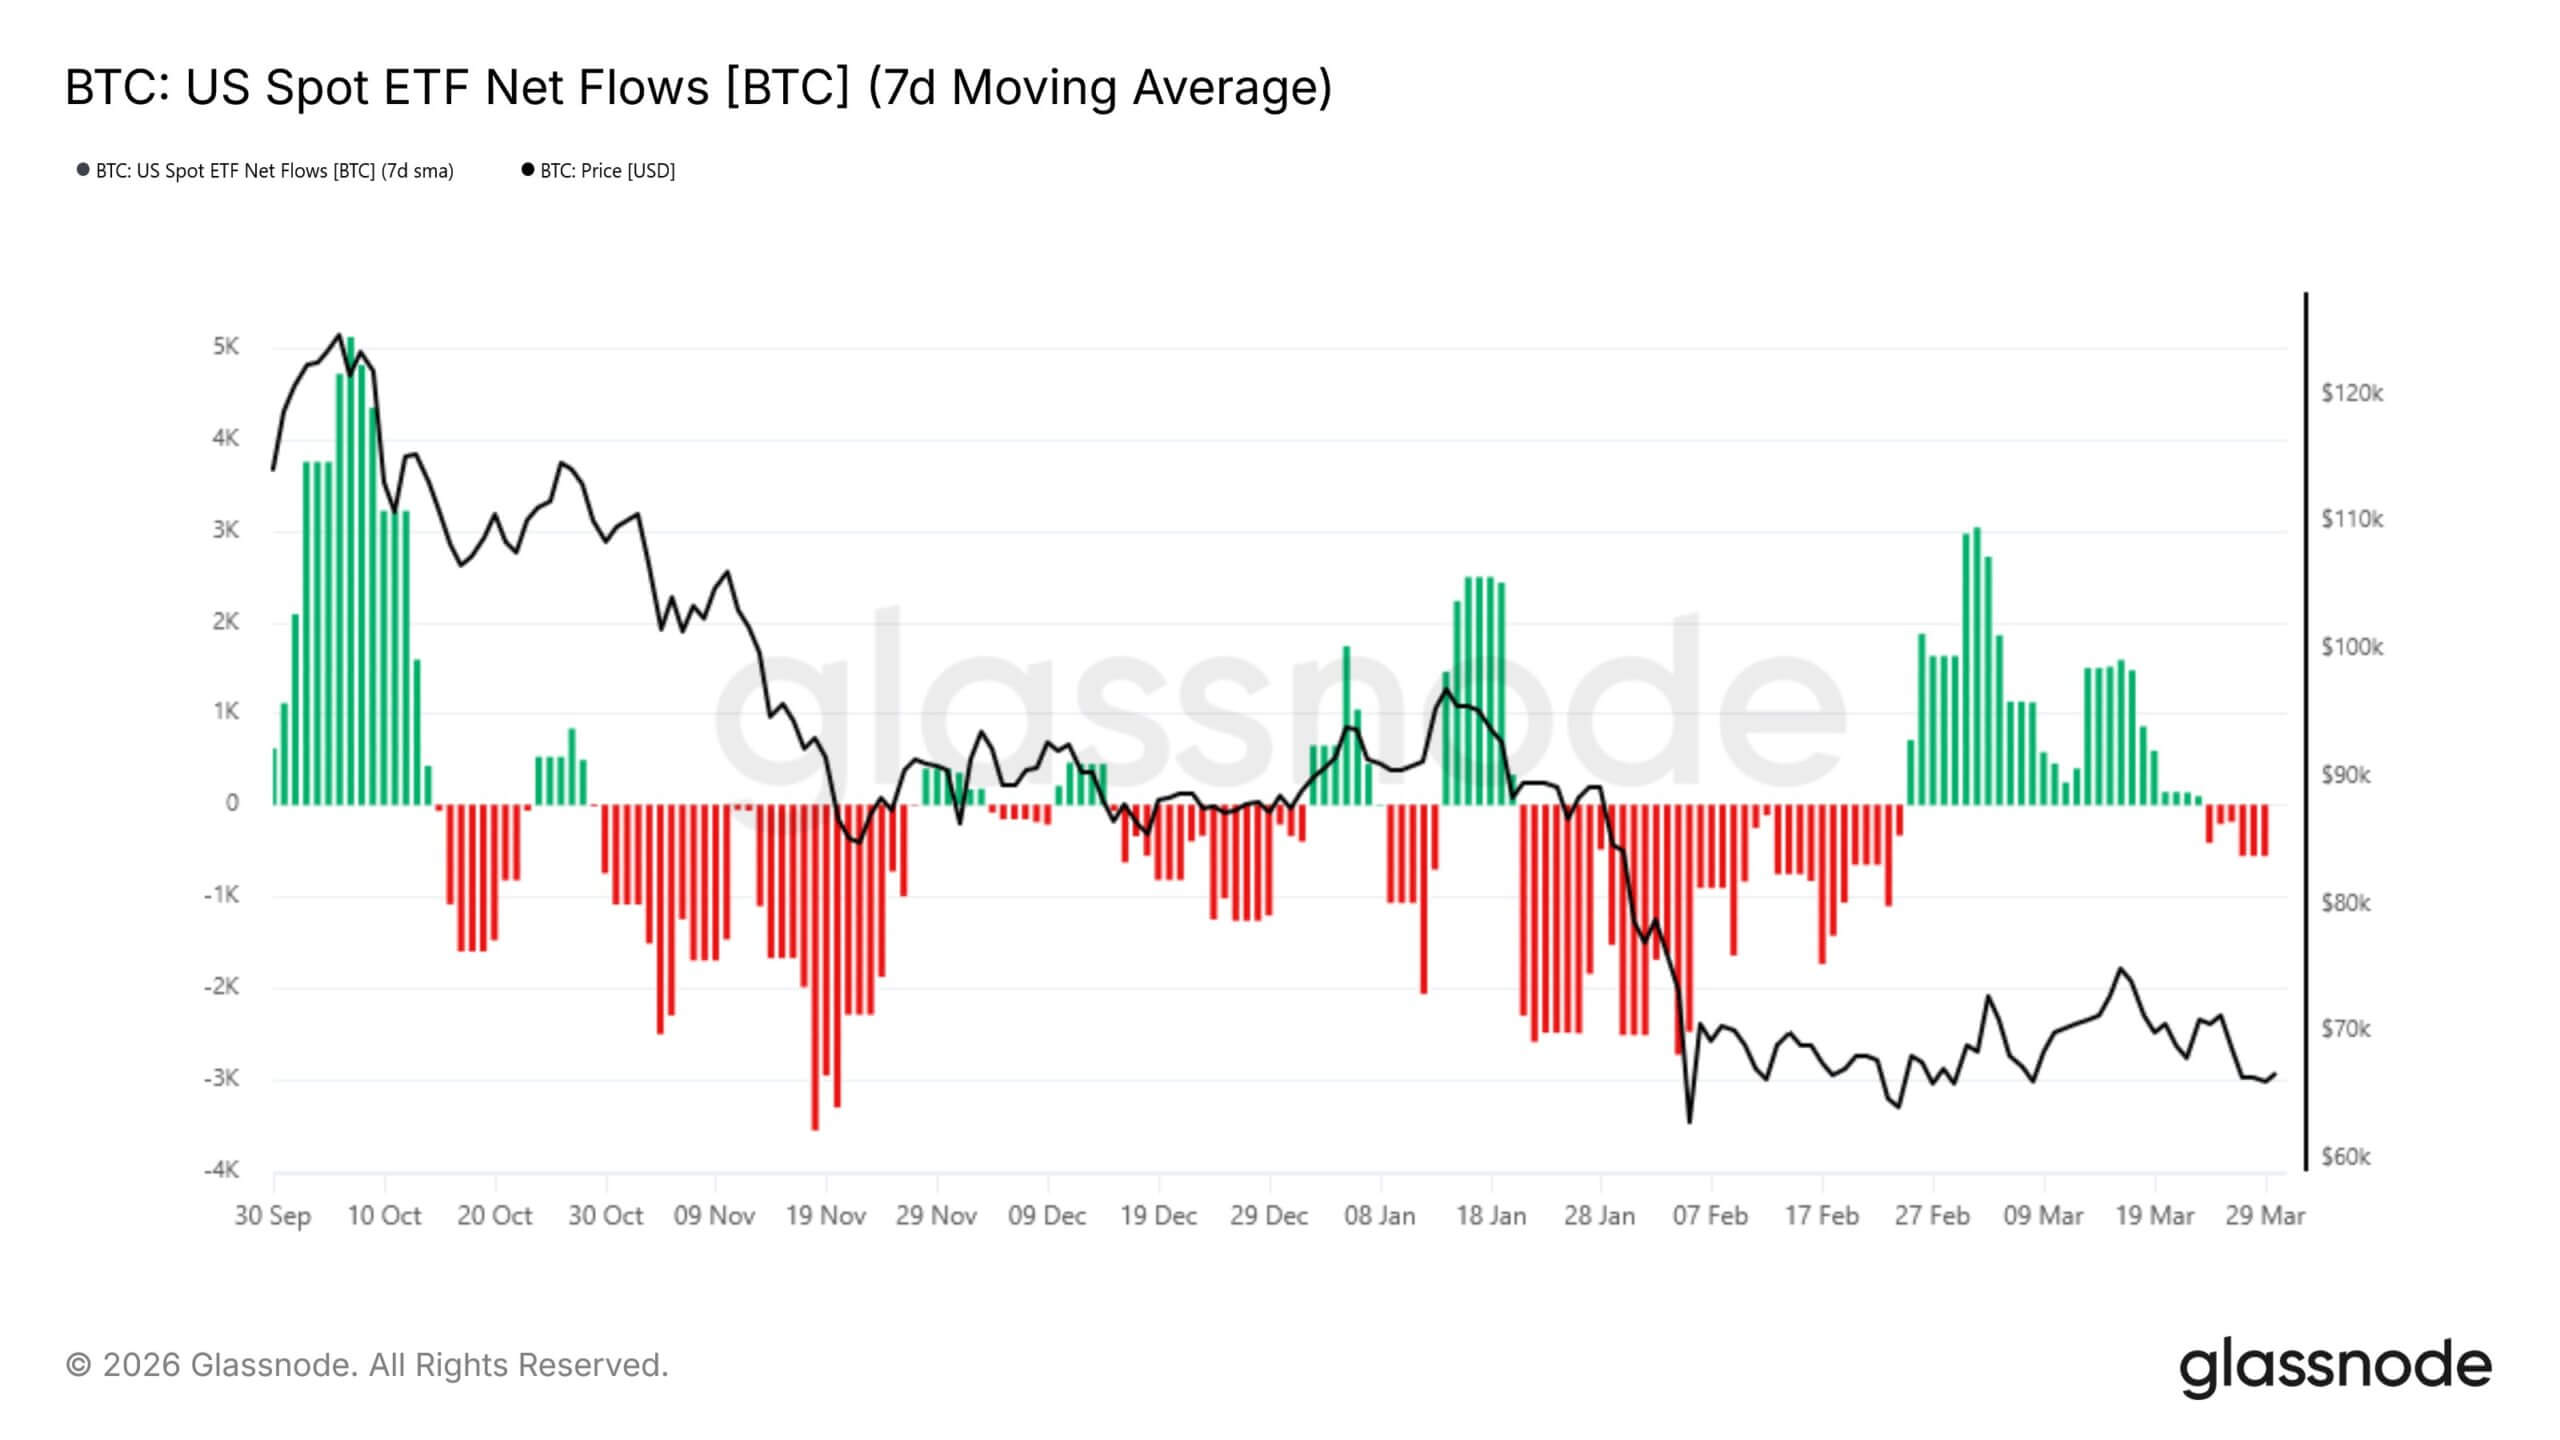
This pattern suggests that while demand is still there, it no longer has the consistency needed to absorb selling pressure.
CoinShares linked the slowdown in demand to two broad factors weighing on the market. That’s due to concerns that the Iran conflict will drag on, and a shift in expectations from the Federal Open Market Committee meeting in June, when investors went from pricing in rate cuts to considering the risk of rate hikes.
This combination exposes digital assets to the same macro repricing that affects other liquidity-sensitive transactions.
Meanwhile, a similar loss of momentum could be seen in corporate bond trading, which was one of last year’s defining themes. What once looked like a broad, publicly traded accumulation story has sharply narrowed, with purchases becoming increasingly concentrated in one company, while activity at other companies has slowed to the worst.
crypto slate According to previous reports, Strategy (formerly MicroStrategy) dominated BTC buying activity among this group, with the company led by Michael Saylor acquiring more than 88,000 Bitcoins during the reporting period. This represents one of the largest quarterly harvests since 2025.
Outside the strategy, the situation was significantly weaker. During the same period, all other Bitcoin treasury companies’ combined purchases were less than they purchased at the peak of trading in 2025.
In some cases, companies that had been pushing for capital accumulation began to move in the opposite direction. After net purchasing 5,342 BTC in 2025 at a weighted average price of $118,171, Mr. Nakamoto sold approximately 284 Bitcoin in March for approximately $20 million at an average selling price of $70,422 per coin.
This transaction demonstrated how rapidly the economics of trade were changing. Companies whose strategies revolved around accumulating Bitcoin ended up selling the coins at a level well below the average price of previous buying campaigns.
The reversal reflects broader strains on the financing model that fueled last year’s bond boom. The trade gained momentum as Bitcoin rose and public market investors rewarded listed companies that provided leveraged exposure to the token through their balance sheets.
As Bitcoin rose, many companies were able to issue stock at a premium to the value of the BTC they already owned, raising new capital and buying more coins. In some cases, companies have taken on additional debt financing to increase their exposure.
This model relied on rising prices and expanding equity premiums. Once Bitcoin stopped progressing, it became difficult to maintain its structure.
This has created tighter feedback loops across the sector. The decline in Bitcoin prices resulted in a decrease in net asset value per share. Lower net asset values and weaker sentiment compressed equity premiums. Subsequently, the shrinking premium reduced the increase in new stock issuance, weakening one of the key tools that companies have been using to grow their Bitcoin positions. As this cycle changed, the financing engine supporting trade began to lose steam.
The results are particularly noticeable in treasury stock. Stocks that once traded at high beta as a proxy for Bitcoin’s rise have plummeted from their 2025 highs, with many stocks underperforming Bitcoin itself.
So what looked like a scalable public market strategy last year became more difficult to execute in a market where the underlying assets weren’t rising fast enough to support the same funding assumptions.
Regular sales of miners start to weigh more heavily
Another important factor that influenced BTC price performance during the period was sales activity by Bitcoin miners. Although the actions of these groups were not the main factor in Bitcoin’s Q1 slump, they became difficult to ignore once demand started to wane.
According to asset management firm VanEck, miners have effectively sold nearly all of the newly minted Bitcoin supply over the past year, about 164,000 BTC.
For context, MARA Holdings provided the clearest example of how that pressure surfaced during the quarter. The company announced on March 26 that it sold 15,133 Bitcoins for approximately $1.1 billion between March 4 and March 25, and used most of the proceeds to buy back convertible debt and reduce debt.
Other miners were also draining the state treasury. Core Scientific sold approximately 1,900 BTC worth approximately $175 million in January and announced plans to essentially liquidate all remaining holdings by the first quarter of 2026. Bitdia reduced its holdings to zero in February, and Riot sold 1,818 BTC worth about $162 million.
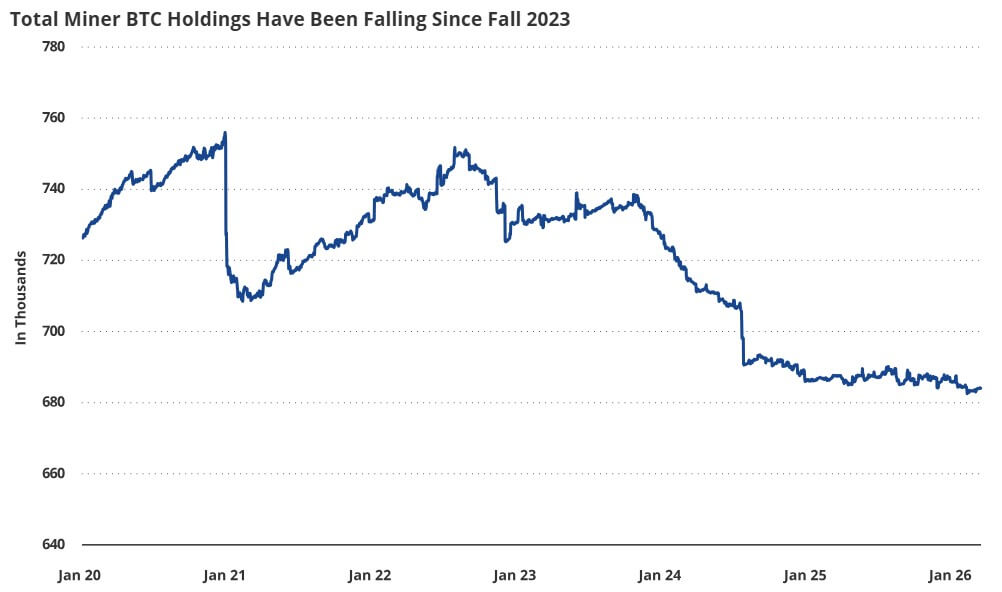
This showed that miners were no longer serving as a meaningful source of net accumulation. Instead, they also became net sellers in a market where ETF inflows became volatile and organic buying weakened.
Meanwhile, the selloff among Bitcoin miners reflected pressure within the mining sector rather than panic about the top cryptocurrency itself.
CoinShares said a sharp price correction and near-record hash rate pushed hash prices to a five-year low. VanEck echoed similar sentiments, noting that the average cash cost to produce one Bitcoin among publicly traded miners rose to approximately $79,995 in the fourth quarter of 2025.
As a result, many businesses have tight profit margins and fewer financing options.
At the same time, more and more miners are directing their capital toward artificial intelligence and high-performance computing infrastructure.
With more than $70 billion in cumulative AI and HPC contracts announced across the public mining sector, companies like TeraWulf, Core Scientific, Cipher Mining, and Hut 8 are increasingly resembling data center operators that also mine Bitcoin, according to CoinShares.
This helps explain why miner sales are important even in the absence of a surrender event. The problem wasn’t that miners were throwing away coins in a panic. It was that they were steadily distributing supply to markets that no longer had the capacity to absorb it.
If inflows from institutional investors were strong, sales on the balance sheet could have limited effect. However, as demand weakened in the first quarter, periodic sales began to weigh on prices.
Long-term Bitcoin holders continue to sell
The pressure intensified as long-term Bitcoin holders continued to sell into the new year.
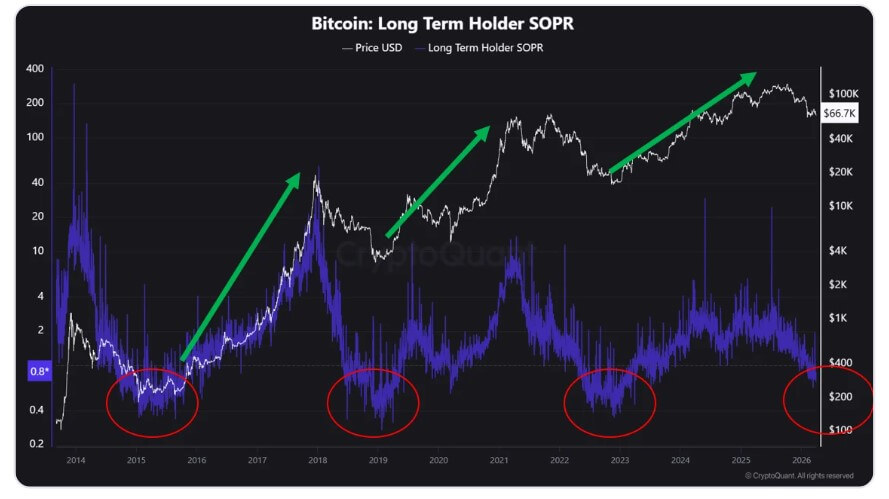
CryptoQuant data showed that this cohort had a spend return ratio (SOPR) below 1, indicating they were selling at a loss.
According to the company,
“Long-term holders are the least sensitive to short-term volatility, so the point at which long-term holders begin to realize losses can be interpreted as a capitulation of the broader market. By this point, short-term holders are likely already out of the market or have suffered significant losses.”
This is corroborated by Glassnode, which noted that realized losses remained elevated through late March but showed no signs of panic, indicating a controlled risk-aversion phase rather than an indiscriminate sell-off.
Unrealized losses are also increasing while remaining within historical standards, suggesting that although stress is accumulating, it has not yet reached a complete loss.
VanEck’s mid-March ChainCheck points to a similar conclusion. According to the report, remittance volumes have decreased month-on-month across age cohorts of long-term holders, indicating that older coins are being used less frequently and the distribution of long-term holders has slowed.
This suggested that some experienced holders were de-risking early in the quarter, but by mid-March the overall pattern had become more subdued.
Taken together, the message this quarter was more nuanced than the simple assertion that smart money was thrown into the fray. Long-term holders were also aware of the losses, but did not panic and handled them cautiously.
As a result, the market faced persistent supply despite less reliable demand, enough to keep Bitcoin under pressure without a full-scale liquidation of this entire cohort.
Bears continue to control derivatives tape
If spot flows and on-chain flows tell part of the story, derivatives tell the rest.
Glassnode said that even though Bitcoin has stabilized, perpetual funding rates remain negative, a sign that traders are still willing to pay to maintain downside risk. It also said that futures open interest remains relatively subdued, suggesting that leverage has not been rebuilt to support a recovery.
The report said spot market activity remained relatively calm after the decline to around $67,000, with volumes showing only a modest reaction, and the rebound appears to be more reactive than conviction-driven.
That’s an important difference. Prices may stop falling before buyers really come back. Until late March, Bitcoin looked more balanced than during the worst of the decline, but not meaningfully bullish.
Options markets showed similar caution. VanEck said the put-call ratio averaged 0.77x in mid-March, the highest level since June 2021, while the put premium relative to spot volume reached an all-time high of about 4 basis points.
Essentially, investors were paying a lot of money for downside protection, even though price trends were stable. It does not indicate that the market is tilted to the upside. It is a sign of someone who is still preparing for the next shock.
(Tag Translation) Bitcoin