


Bitcoin is no longer responding to increases in global liquidity as it did in previous cycles. Even though the money supply is expanding, the dollar’s strength is tightening financial conditions faster than liquidity is pushing prices up.
Bitcoin traders prefer one chart over most others. It is global M2 liquidity with a time lag.
As more money expands around the world, money will eventually flow into risk assets, and Bitcoin will be riding the wave. In past cycles, that framing looked clean enough to be treated as a matter of principle.
That framework is currently in trouble. Broad money is still trending higher, but Bitcoin is trading like an asset stuck at a macro ceiling.
why is this important: This shows a change in how macro signals are translated into the crypto market. Expanding liquidity alone is no longer enough to push prices up in the short term, as faster-moving factors such as a stronger dollar and interest rate expectations take precedence.
For investors, this changes how Bitcoin should be interpreted, not as a simple proxy for liquidity, but as a market that reacts to competing macro velocities.
According to FRED data, US M2 in February was $22.667 trillion, up from $22.469 trillion in January and $22.387 trillion in December.
While these numbers clearly represent a backdrop of economic expansion, a Bitcoin price of nearly $68,000 paints a completely different picture.
Traders combine two different macro sending rates into one chart and expect decent results.
2 watches, 1 price
M2 is the monthly inventory indicator. It accumulates gradually over quarters, and the impact on risk assets is similarly slow.
Expanding liquidity conditions broadly eases financial conditions, lowers hurdle rates, eases the availability of credit, and tends to direct capital toward riskier positions.
But it will take many months for that process to fully manifest itself in prices.
Dollar strength runs on a completely different clock. When the dollar index rises, financial conditions tighten almost immediately.
The Fed’s own minutes make clear that a stronger dollar, higher yields, and lower stock prices combine to tighten financial conditions.
BIS research confirms similar transmission, and IMF analysis found that a 10% dollar appreciation linked to global financial market impacts would reduce emerging market output by 1.9% within a year, worsening credit availability and capital inflows in the process.
March demonstrated just that hierarchy. Safe-flight demand, the Iran war, the oil crisis and a sharp reassessment of expectations for Fed rate cuts led investors to move back into the dollar index, which rose 2.35% for the month and 1.7% for the quarter, its best quarter since late 2024.
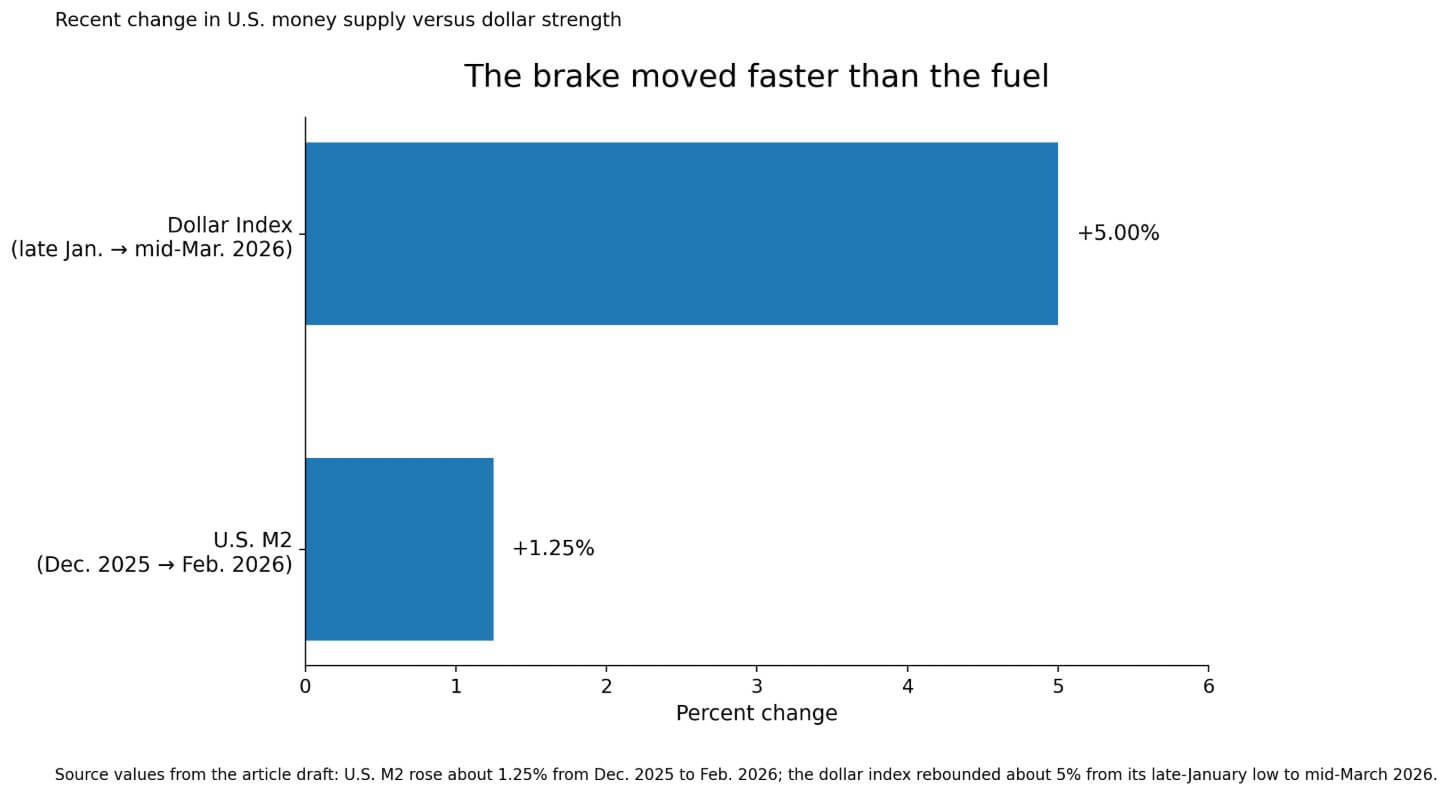
By mid-March, the dollar index had already rebounded about 5% from its four-year low in late January.
Over the same period, US M2 rose by about 1.25%. The brakes moved about four times faster than the fuel.
key shift This does not mean that liquidity has stopped expanding, but rather that it is being overtaken by increasingly accelerated tightening forces. Bitcoin responds not only to the direction of change, but also to the speed of change.
Why Bitcoin absorbs dollar movements first
Bitcoin occupies a special position among risk assets. We continually trade in trading locations around the world, against the dollar and on dollar proxies, attracting a global investor base and calculating returns in dollar terms.
This makes it one of the quickest markets to absorb dollar tightening before the gradual accumulation of M2 works through credit channels, capital flows, and broader risk appetite.
The oil shock is compounded by the March Commodities Survey, which raised its 2026 Brent oil price outlook to $82.85 per barrel from $63.85 a barrel the previous month, the steepest upward revision in the survey’s history, and warned that Brent oil prices could reach $190 if the Strait of Hormuz remains closed.
An oil shock of this magnitude raises inflation expectations and forces the market to price in a rate cut. By December, markets had gone from pricing in at least 50 basis points of Fed easing to fully pricing in barely a quarter-point rate cut.
This repricing will be reflected in the dollar and interest rate markets within a few days, and M2 data for the corresponding period will not be published for another month.
More subtle points reinforce this. The most popular “Global M2” chart aggregates foreign money stocks and converts them into dollars, so exchange rate fluctuations affect the overall index.
| variable | Communication speed | Impact on Bitcoin |
|---|---|---|
| M2 / wide liquidity | Accumulates slowly over several months | Acts as a tailwind behind risk appetite |
| dollar strength | Reprice quickly, within days or weeks | Rapidly tightening financial conditions, putting pressure on BTC |
| Oil/Fed Repricing | very fast | Strengthening dollar strength and delaying liquidity development |
When the dollar appreciates, the dollar value of foreign currency aggregates is compressed, even if local currency measures remain stable.
As one data provider points out, exchange rate fluctuations can have a similar impact on overall liquidity and need to be considered in conjunction with raw money supply figures.
The dollar works on two levels. One as a conflict variable that is run in parallel with the M2 chart, and the other as a variable that is already entered directly into the compound calculation.
A stronger dollar could simultaneously slow the chart’s rise and undermine the importance of the chart’s direction for Bitcoin.
M2 Actual content of the paper
All of this narrows the scope of the M2 paper. Broad money is useful for representing background liquidity conditions over multiple months, especially when the dollar is stable or depreciating.
In this environment, gradual accumulation of money supply could act as a modest tailwind for risk assets, with Bitcoin among the more sensitive beneficiaries.
In a calmer macro regime, this relationship looks cleaner precisely because the fast variable, the dollar, is pointing in the same direction, or at least out of the way.
This episode confirms this hierarchical structure. When dollar strength and risk aversion dominate the short-term situation, Bitcoin can be pinned well below where only the rising M2 line would place Bitcoin.
The bullish case is that the dollar rally in March turns out to be temporary. The dollar’s tightening impulses will quickly subside as geopolitical stresses ease, oil retreats from its highs, and markets reassess the Fed’s easing of monetary policy.
Some strategists believe some of the dollar’s movement in March was a risk premium that could fade once conditions stabilize. In such an environment, the underlying M2 tailwinds will strengthen again in the coming months, and Bitcoin’s deviation from the liquidity chart will disappear, making traders who claimed that the M2 theory has failed appear premature.
| scenario | what will change | What it means for Bitcoin |
|---|---|---|
| Bull case: The sharp rise in the dollar subsides | Geopolitical Stresses Ease, Oil Retreats, Some of the Fed Easing Is Priced Back | M2 tailwind strengthens again, allowing BTC to close the gap with the liquidity chart |
| Bearish case: dollar maintains dominance | Crude oil, risk aversion, and asset volatility remain high | BTC may continue to diverge from M2 script for longer than liquidity watchers expect |
A bearish case would be for the dollar to extend its dominance. HSBC strategists said the dollar’s dominance will remain as long as oil prices, risk aversion and volatility across assets remain high.
In that scenario, Bitcoin could continue to diverge from its M2 script for longer than most liquidity watchers expect. High oil prices and compressed interest rate cut expectations delay the moment when background money growth is reflected in market performance each month.
next test The question is whether the dollar’s momentum will collapse before liquidity catches up. If the dollar stabilizes or reverses, Bitcoin has room to readjust to a fundamental expansion of the money supply. If this is not the case, the divergence may last longer than the liquidity model indicates and traders will need to recalibrate the factors that are actually driving the price in the current cycle.
(Tag translation) Bitcoin