


Ethereum is showing two warning signs at the same time, with a large liquidation cluster sitting just above the price around $2,100, while momentum is weakening on the daily chart. Overall, this setup points to a narrow zone. $ETH If pressure builds in either direction, we could see a sharper move next time.
$ETH RSI break suggests weakening momentum
this $ETH daily chart shows the rising wedge structure that formed after the February selloff. The price has slightly lowered its lows, but the upside remains near the same resistance zone around $2,200. As a result, buyers pushed $ETH Although the price has risen from the low, it has not broken through the ceiling.
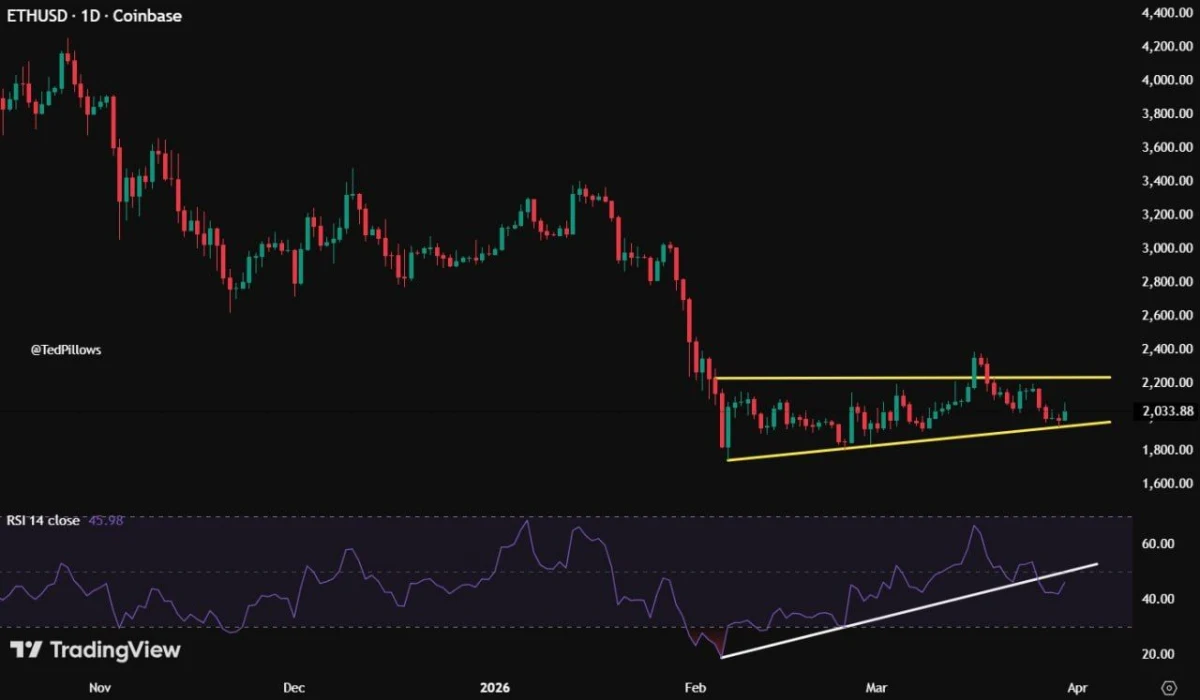
ETHUSD 1D Chart: Source: TradingView, TedPillows on X
The more important part of the chart is the RSI line below. Prices have been on an upward trend since early February, supporting a gradual price recovery. Currently, the RSI uptrend appears to be breaking. This usually means that the price is losing momentum even before it fully breaks out. So, Ted’s point is that RSI weakness may come first, followed by price.
Right now, $ETH It’s still in the pattern. Therefore, the chart has not yet confirmed the breakdown. However, the setup looks fragile. if $ETH Losing the lower ascending trendline around the $2,000-$2,030 area could cause the wedge to fail and the price could possibly revisit the February low area around $1,900 and $1,750-$1,800.
On the other hand, if $ETH This bearish view will weaken if it regains strength and closes above the horizontal resistance near $2,200. In that case, the current pattern may change to a more robust recovery attempt rather than a failure setup.
Therefore, the chart is bearish for now as momentum initially weakened while price was still testing support.
$ETH Facing significant liquidation pressure near $2,100
This CoinAnk liquidation heatmap shows the largest $ETH The liquidation cluster is near the $2,100 level. The brightest areas on the chart are clustered around that zone, and when price moves within that zone, it means that large leveraged positions can be eliminated.
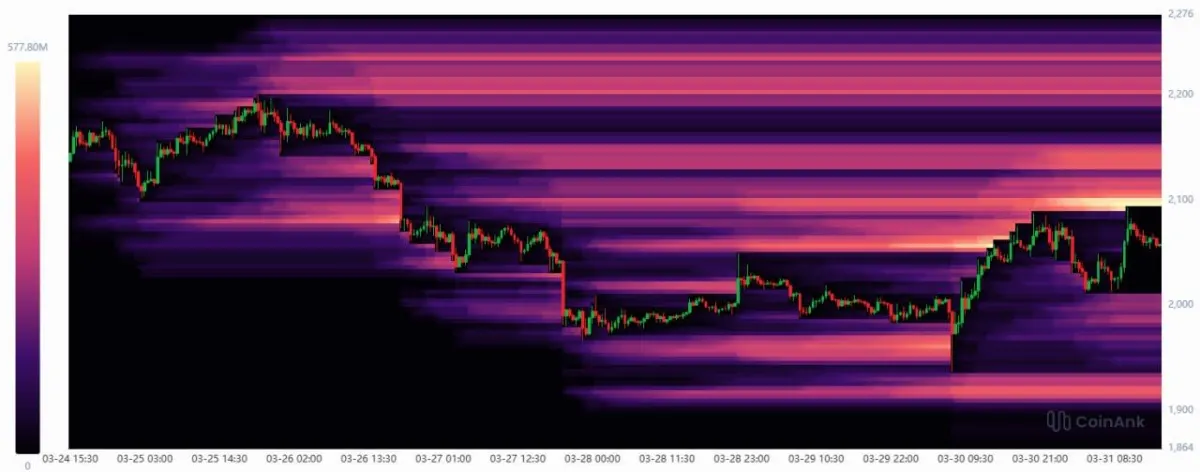
$ETH Liquidation heatmap: Source: CoinAnk, CW on X
This is important because liquidation zones often act like price magnets. In other words, as liquidity increases, the market is likely to move towards these levels. Here, the chart suggests that the main area traders are looking at is $2,100, as it has the highest concentration of potential liquidations.
At the same time, the chart also shows that liquidity is piling up above that area, specifically between about $2,100 and $2,200. So, if $ETH A push to $2,100 could lead to a rapid increase in volatility. Moving into that zone can trigger a forced exit and result in a sharper reaction.
Below, we see support liquidity around $1,900 to $1,950. therefore, $ETH It trades between two important pockets of liquidity. Still, the clearest message from the chart is that $2,100 stands out as a major liquidation level and the most likely upside pressure point.