


Bitcoin enters the weekend with a broken short-term structure, rising macro pressures, and a political catalyst that currently sits near the center of the market risk map.
The technical setup has progressively deteriorated over the past two weeks. The macro environment remains tight as US Treasury yields rise and Middle East risks continue to arise through oil, inflation expectations, and interest rate-sensitive assets.
Superimposed on both is President Donald Trump’s public messaging on Iran, which has repeatedly shifted sentiment across familiar variables in recent months: stocks, bonds, oil and cryptocurrencies.
His social media posts over the weekend on tariffs, Venezuela and Greenland all had similar effects on the market. President Trump has made most of his major announcements this year while markets are closed, and things are now gearing up for a new intervention.
Within the channel framework that has been tracked since the Spot Bitcoin ETF launch period, BTC price has already completed the difficult part of the bearish rotation. Having lost the high half of $73,000 and not being able to confidently regain $71,500, it broke above $68,000 and then fell below $66,900. This sequence of events turns Friday’s trading into the weekend, and the market remains in the lower range.
In this structure, the next defined support channel is between $61,700 and $61,100. For now, $61,700 stands out as the next major level if macro pressures remain strong and no new easing signals come from Washington.
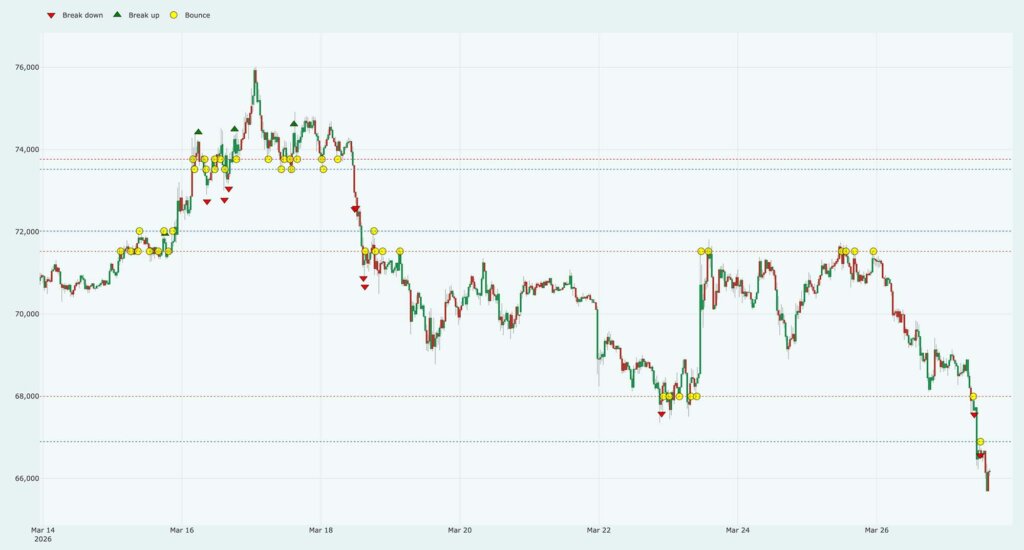

Out of a total of 400 interactions with defined channel boundaries, 304 were bounces, 44 were higher breaks, and 52 were lower breaks. This distribution shows that the market still respects structure. Bitcoin continues to react to these zones in a disciplined manner, giving the current breakdown even more analytical value.
Markets do not move randomly across the map. As we move from one channel to the next, the role of the previous boundary changes each time reuse fails.
The most obvious example is $71,500. This line served as an important floor during the mid-March sequence and became the strongest visible ceiling when prices fell on March 18th.
BTC returned to that area several times around March 23rd and March 25th, but both attempts stalled. This pattern has made $71,500 the main recovery threshold for a bullish recovery. Below that, $68,000 became the next pivot.
After the initial break around March 22nd, BTC briefly re-entered that channel, leaving the possibility of stabilization open. On March 27, that window of opportunity narrowed sharply when the price lost $68,000 again and then broke above $66,900, failing the first retest from the bottom.

This leaves a clean ladder in the market.
The first resistance level is currently at $66,900. The next resistance and more important recovery line is $68,000. On top of that is $71,500, where more extensive structural repairs will begin.
On the downside, the next defined support channel is $61,700 to $61,100. If the market loses one channel and cannot recover its lower bound, the next channel below it becomes the real attraction. That is where BTC is heading into the weekend now.
The macro overlay increased its downside pressure. The Fed held interest rates unchanged in its March 18 policy statement and said inflation remained moderately high. The central bank’s latest forecast maintained a backdrop of subdued policy flexibility and continued uncertainty.
Cryptocurrencies can rise under these circumstances, but if long-term yields rise and oil feeds inflation risk back into the interest rate complex, the strain on the market structure increases.
This stress has been evident in bond markets throughout this week. On Friday, the 10-year Treasury yield hit 4.48% in early trading, its highest level since July, but has since fallen slightly.
The exact intraday high is less important than the broader point. Yields are rising again towards this week’s cap, with markets still pricing geopolitical risks into energy and growth expectations.
That’s where President Trump’s message is relevant to Bitcoin over the weekend.
Risk assets responded positively earlier this week after President Trump signaled progress on Iran-related talks. Stocks rose and oil fell after President Trump suggested the U.S. and Iran were in talks and hinted at a possible end to the conflict.
As the market tilted toward peace expectations, U.S. bond yields temporarily fell on hopes of easing tensions. That feeling of relief didn’t last long. Stocks fell again on Friday as markets regained much of the optimism associated with President Trump’s latest delay and renewed concerns about the conflict pushed oil prices higher.

This pattern has now become familiar enough to be important for weekend framing
President Trump’s public comments on Iran have repeatedly served as a source of short-term volatility for the broader market, especially when they suggest detente or renewed conflict.
Even as confidence in new interventions becomes more conditional, his social media influence could still temporarily sway markets.
For Bitcoin, this means a diplomatically-leaning weekend post could help generate relief heading into Monday’s open. While yields and oil are strong, without any hardening rhetoric or soothing messages over the weekend, the broken structure will be exposed to another leg.
This is true if you keep $61,700 front and center. The technical path to reach that level does not require new panic events.
The market has already lost its short-term floor to suppress prices to higher price ranges. The initial breakdown to $68,000 around March 22nd looked vulnerable to mean reversion, and BTC actually re-entered the channel.
The latter interruption had more significance as it occurred after several days of unsuccessful recovery attempts. It has since topped $66,900. If that level failed and the first retest did not pass, the next support channel below it became the relevant destination in the existing map.
I believe that’s also the cleanest way to think about your weekend setup. Bitcoin is now trading as if the market is trying to repair the damage from March 18th. It is trading as if the market is deciding how low the next balance area should go.
I’m not asking if BTC can go up. can. What I’m looking at now is whether there’s a rally that can restore the broken perimeter and keep it as support. Until that happens, any upward movement primarily serves to test resistance.
Threshold is clear at this time
Getting $66,900 back quickly would reduce the immediacy of the latest breakdown. A rally above $68,000 would restart the discussion of a mean-reverting rebound over the weekend, especially if it coincides with falling yields, calming oil prices, or a new message from President Trump that the market interprets as de-escalation.
The recovery reaching $71,500 is even more significant as this is where the last few recovery attempts failed. These are conditions that will force a broader reassessment.
If BTC remains capped below $66,900 and fails to recover $68,000, the lower channel will remain active. In that case, $61,700 would be the next major support to monitor throughout the weekend, and $61,100 would be a deeper boundary in the same bracket.
A move into this zone would fit the logic of the recent structure, the current interest rate backdrop, and the risk of political events currently heading into the weekend.
This also applies to the larger features of this decline. This graph shows gradual deterioration rather than chaos.
First, the market lost the $73,800 to $73,500 zone. Subsequent concessions were $72,000 and $71,500. The market then spent time falling below those levels before breaking out of $68,000 and $66,900. At each stage, the market has less room to stabilize at higher prices.
Each failed reuse adds weight to the next lowest support channel.
Therefore, as of Friday’s close, Bitcoin remains in a narrow but readable setting. The short-term structure has collapsed. Macro pressures remain elevated as US Treasury yields remain near recent highs and Middle East risks continue to impact oil and inflation expectations.
President Trump’s comments on Iran remain a political catalyst, even if their effectiveness has become less durable over time, as they have shown that they can quickly move sentiment across assets.
This leaves BTC with a simple weekend map. The market could claim relief by recovering $66,900 and then $68,000. If we stay below those levels, $61,700 remains the next obvious level to watch.
(Tag translation) Bitcoin