


- Ethereum price has escaped a prolonged consolidation below $2,142, and has once again shown resilience towards $2,447.
- steady rise $ETHThe estimated leverage ratio indicates that traders are gradually returning to the derivatives market with increased confidence.
- The coin price moving above the 20-day and 50-day exponential moving averages further strengthens the bullish momentum in the market.
Ethereum, the second-largest cryptocurrency by market capitalization, showed low volatility on March 17th and is currently trading around $2,330. Neural candles on the daily chart indicate some short substance and price rejection, suggesting uncertainty from buyers to sellers to fuel a sustained surge. However, traders have built up underlying leverage positions in derivatives markets, raising hopes for a strong recovery ahead.
$ETH Leverage recovers and recovers after historic liquidation
The crypto market has seen a notable recovery since last week despite uncertainty due to geopolitical tensions. Following this momentum, Ethereum’s price rebounded from $1,927 to $2,321 in one week, a 20% increase. As a result, the market capitalization of assets soared to $280 billion.
A notable factor in this surge may be related to strong ETF inflows indicating institutional investor appetite.
However, a shared analysis by oinonen_t shows Cryptoquant’s chart of Ethereum’s estimated leverage ratio (ELR) on Binance.
On October 10, 2025, a severe flash crash hit the crypto market, forcing the closure of over $19 billion in leveraged positions across exchanges in 24 hours. The event was the largest wave of liquidations in the sector’s history, affecting millions of traders and triggering a cascading decline in major assets such as Bitcoin and Ethereum.
This disruption led to a massive deleveraging of Ethereum derivatives on Binance. Ethereum’s CryptoQuant (ELR), open interest $ETH Exchange reserves decreased from 0.56 to 0.41, a decrease of 27%. This measure is an average of the leverage used by traders, with a high measure indicating aggressive positions with borrowed funds compared to available collateral, and a low measure indicating reduced risk-taking and position unwinding.
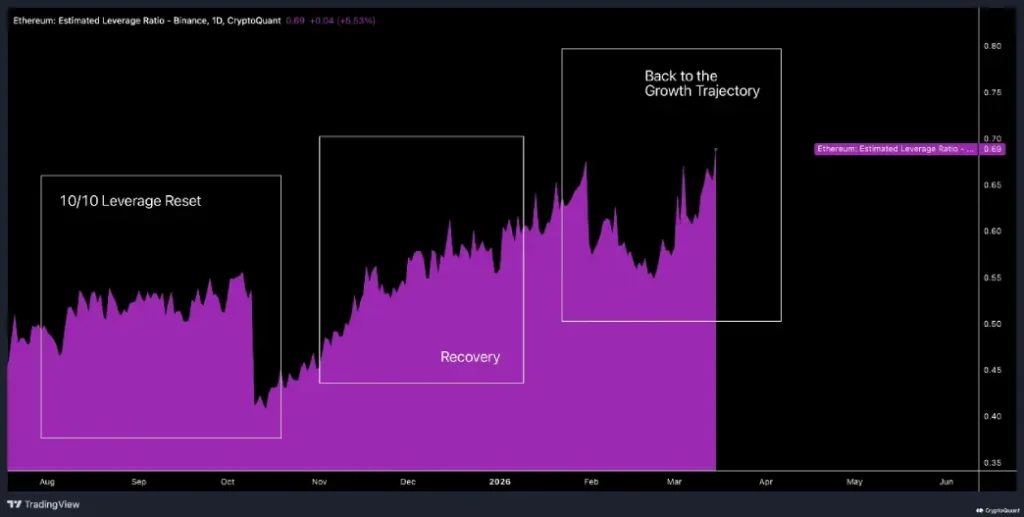
The reason behind the crash was a combination of macroeconomic pressures such as trade-related announcements and pre-existing high leverage that amplifies the impact of price movements when liquidity is low. This was a big fresh start in terms of market exposure.
In the following months, Ethereum ELR on Binance returned to 0.69 by mid-March 2026. This upward trend may suggest that traders are slowly returning to higher leverage in derivatives with the resurgence of digital assets.
Ethereum price holds key pivot level at $2
On March 15th, Ethereum price bullishly broke through the $2,142 resistance level, marking an exit from the rectangular pattern. Since early February, the coin price has actively resonated within two horizontal levels of $2,124 and $1,180, demonstrating market uncertainty amid geopolitical tensions.
The recent breakout indicates renewed recovery momentum from (Average Directionality Index), suggesting a strengthening of the recent breakout.
With continued buying, Ethereum price is poised to rise by 5% and challenge the long-term trendline resistance at $2,447. The downslope facilitates the current correction. $ETHthe previous encounter significantly changed the direction of the price.
Therefore, a possible breakout of the resistance could further accelerate the buying pressure and lead to stronger buying. $ETH Toward a rise to $3,000.
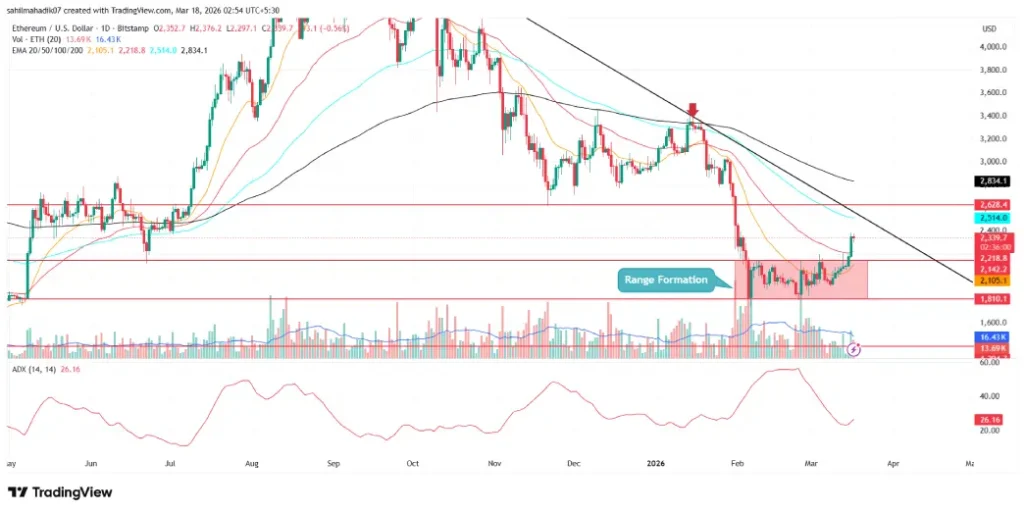
$ETH/USDT -1 day chart
However, if sellers continue to face overhead supply at this resistance level and create a reversal pattern, the coin price could face further correction.