


Bitcoin’s oft-cited “Ramadan Rally” setup could disappear by 2026. However, the volatility pattern that many traders have noted in recent years appears to still exist.
To be clear, Islam’s holiest month has nothing to do with digital assets. Cryptocurrencies are traded based on global liquidity, macro news, positioning, and sentiment.
Still, looking at the past seven Ramadan periods (2019-2025), Bitcoin has shown a surprisingly consistent shape in 6 out of 7 cases: an initial sharp move, followed by volatile trading, followed by a decline or decline. The main exception was 2020, when stronger macro recovery trends dominated.
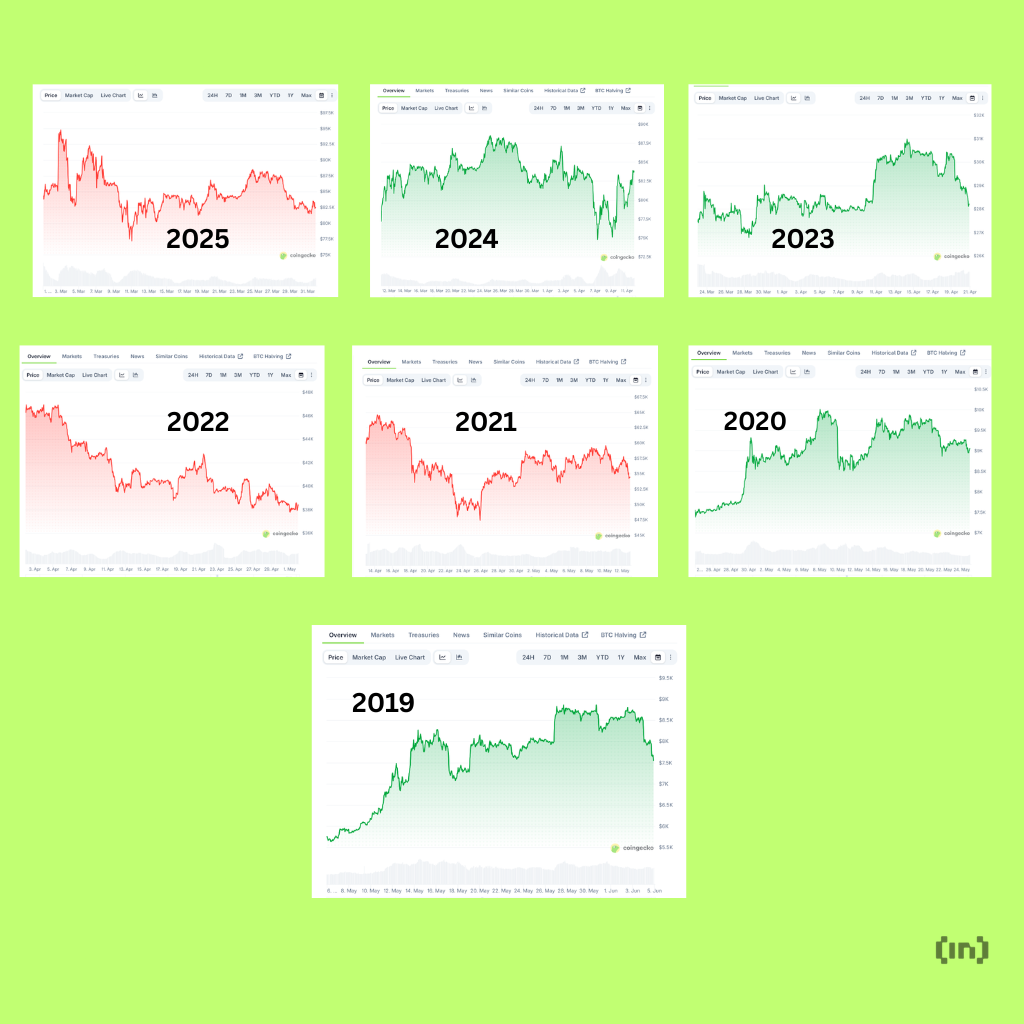
Bitcoin price chart for the past 7 years of Ramadan
What the past seven Ramadans have shown us
This pattern was not “Bitcoin always rises in Ramadan”. That’s not true.
Instead, the repeating pattern was more specific. Bitcoin has frequently seen front-loaded volatility. Typically, there was a strong early move, followed by depletion and a weak exit in the middle of the period. In some years, Bitcoin still ended Ramadan at an overall high. But even then, prices often fell back after peaking in mid-Ramadan.
As such, this is more of a timing and structure pattern than a directional pattern.
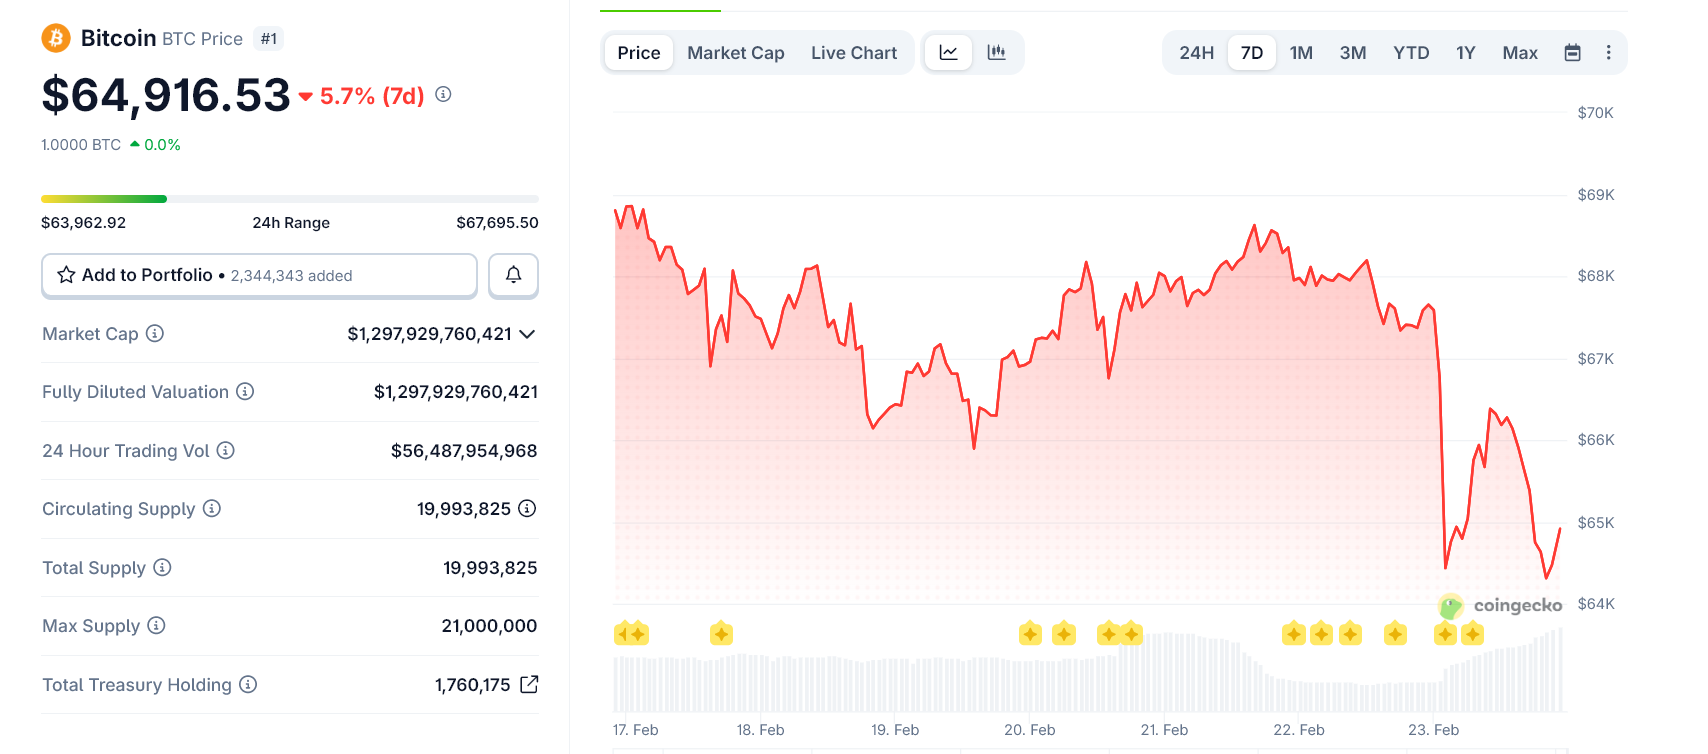
Bitcoin price chart for the past week. Source: CoinGecko
What will change in 2026?
The first week of this year looks different in one important way. Bitcoin did not open with a clean rebound. It started with a chop, then a sharp flash, and only after that did the bounce attempt begin.
That is, the shape of the pattern is still familiar: quick movements, emotional swings, unstable recoveries, but the order has changed. At least for now, the market appears weaker than during the strong months of Ramadan.
On-chain data shows why Bitcoin remains weak in Q1
On-chain images are mixed.
First, Binance’s purchasing power index has fallen to a level that was previously compressed and close to exhausted.
It’s a contrarian positive. This suggests that a bailout rebound may occur if selling pressure eases.
Binance Purchasing Power Index Hits Familiar Lows
“The data shows a familiar pattern: the purchasing power window compresses, the market catches its breath, and, if history holds its own, it tends to resolve to the upside.” – @Crazzyblockk
Full analysis ⤵️ https://t.co/S5xEk9EgCo pic.twitter.com/7pGU0nh76n
— CryptoQuant.com (@cryptoquant_com) February 23, 2026
Additionally, network activity has been weak for six consecutive months. That’s a structural warning. This suggests demand and participation remain weak, which could make gatherings vulnerable.
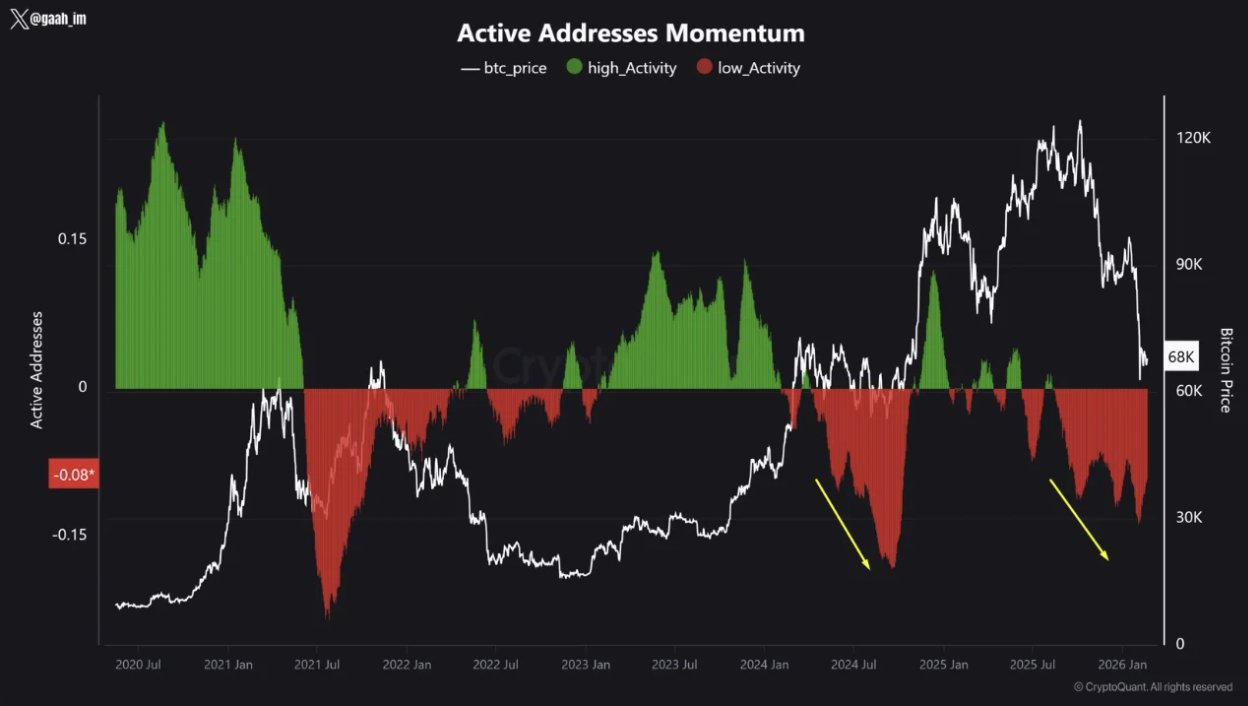
An active address on the Bitcoin network. Source: CryptoQuant
Third, even after the worst of the capitulation subsides, realized losses for short-term holders remain negative.
Simply put, panic selling has slowed, but many recent buyers are still exiting with losses. This typically indicates the formation of a base rather than a firm uptrend.
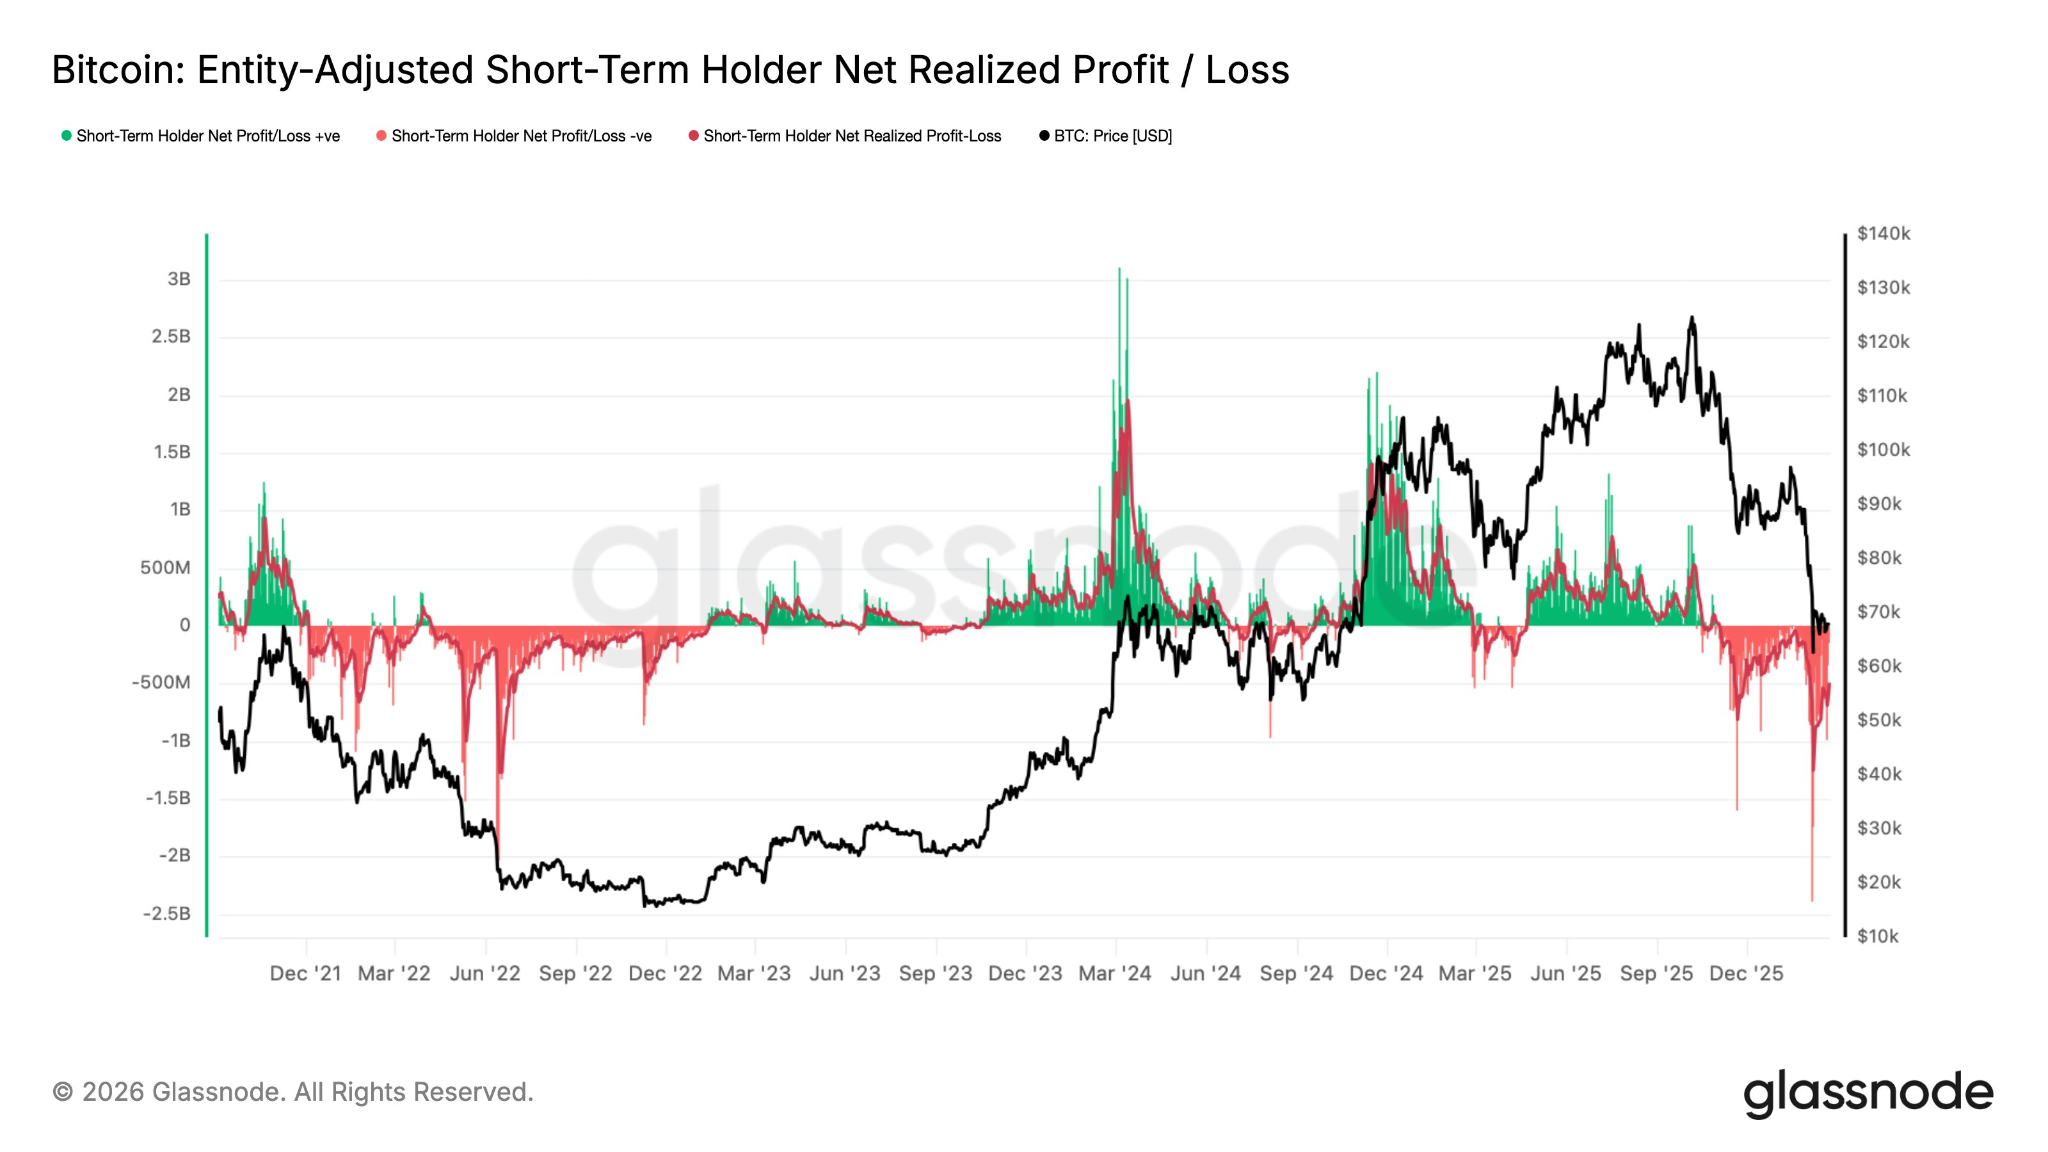
7D-EMA of recent investor net realized gains and losses. Source: Glassnode
Overall, there is a good chance that Bitcoin will recover or attempt a volatile recovery in the coming weeks, especially if Binance’s purchasing power signals play out.
However, the on-chain demand and STH P&L context suggests that the upside may be fragile and resistant initially.
In other words, the former Ramadan “rise” narrative appears to be weakening in 2026. Still, the broader pattern of early volatility, sharp swings and uncertain follow-through remains visible.
The article “Bitcoin’s famous Ramadan rally is unlikely to occur in 2026, but some patterns are well known” was first published on BeInCrypto.