


Bitcoin’s price at the time of writing was $69,383, giving the digital asset a market capitalization of $1.38 trillion, backed by $45.37 billion in 24-hour trading volume, while intraday fluctuations between $67,098 and $70,434 reflect the market still regaining its footing after a steep multi-day pullback.
Bitcoin chart outlook
After falling more than 30% from the $97,900s to the mid-$65,000s, Bitcoin is looking to stabilize, but the higher timeframe charts still reflect the market digesting a large amount of distribution. Volatility has come down slightly, but structurally the burden of proof remains overhead.
On the daily chart, the adjustment structure remains intact. The fall from $97,939 unfolded like a waterfall, culminating in a definitive breakdown on February 12th, when sales volume exceeded 10,000 units (nearly double the previous average) and distribution was confirmed. The price is currently hovering around $65,000, which is consistent with the 38.2% Fibonacci retracement level, while resistance lies at $70,000 and $75,000. This formation resembles a descending triangle, where Bitcoin continues to close below important dynamic levels. Unless we increase trading volume to recover $72,000, the bias on the daily timeframe will remain depressed despite intermittent stabilization attempts.
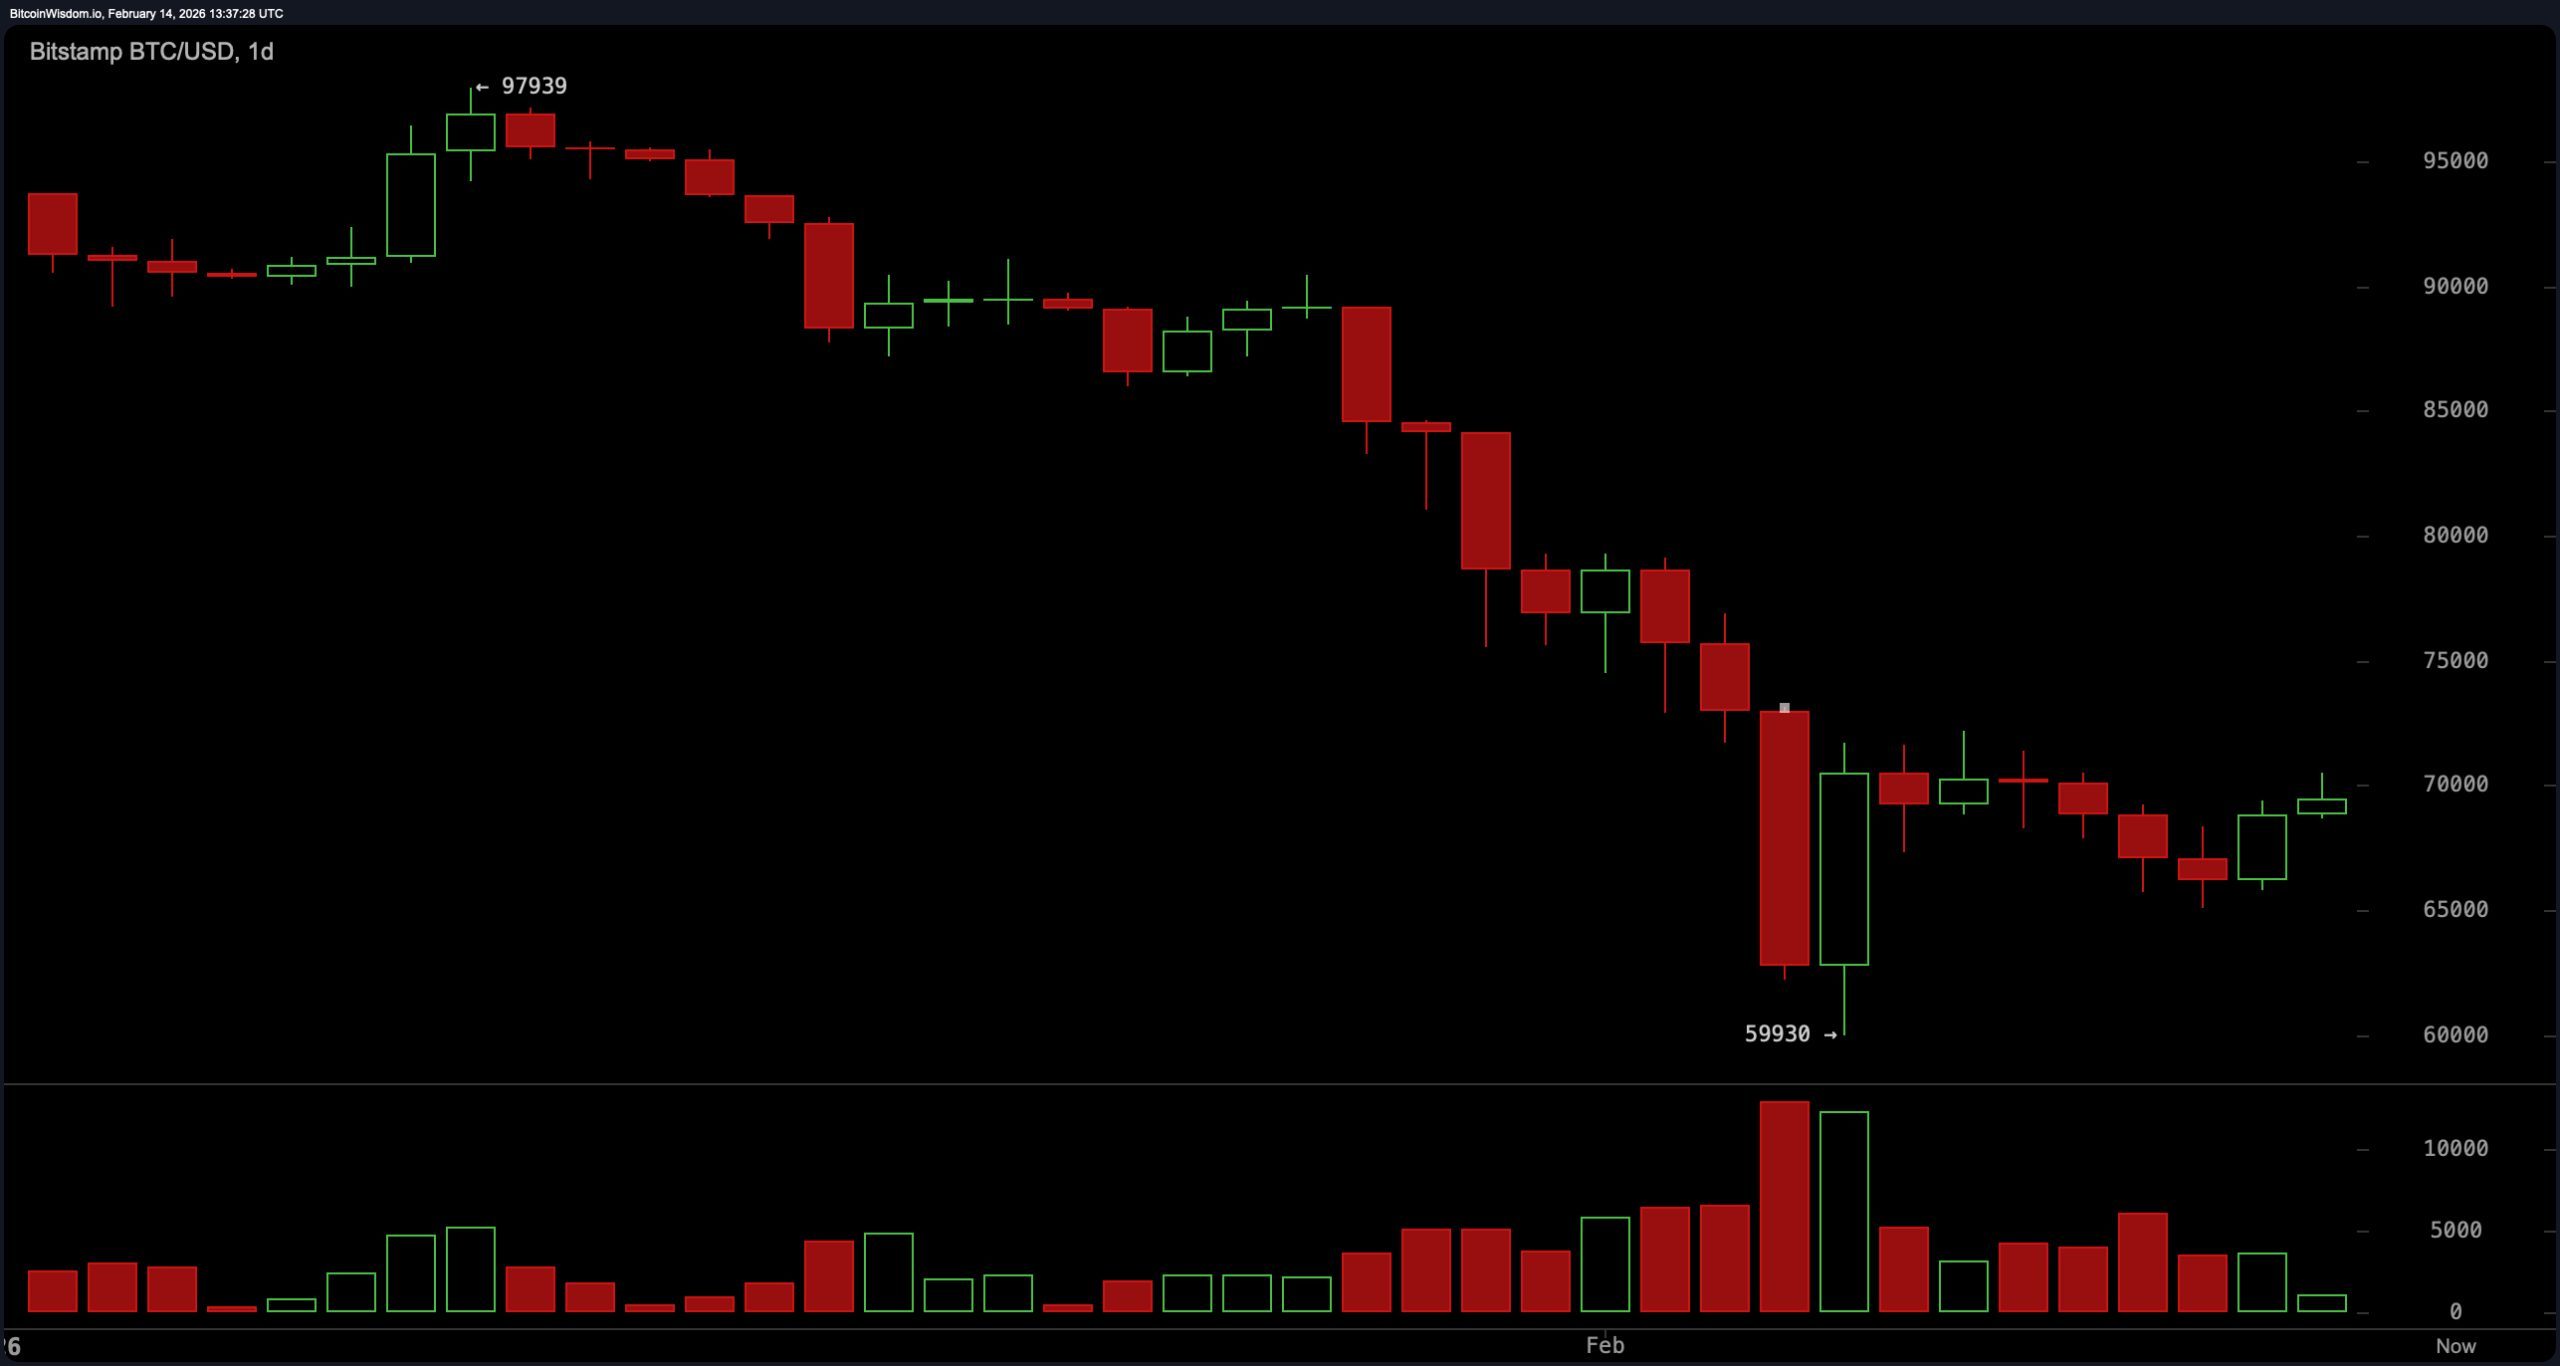
$BTC/USD 1-day chart via Bitstamp on February 14, 2026.
The 4-hour chart reinforces this position. Bitcoin fell approximately 9.5% from $72,174 to $65,800, compressing into a narrow range of $65,800 to $66,500. A series of red marubozu candles and a shooting star near $69,500 preceded the accelerating decline. During the Feb. 12-13 downturn, sales volume expanded to more than 2,000 units, well above the standard of 800-1,200 units, signaling capitulation. The subsequent rebound has seen sales volumes remain below 500, suggesting a sustained lack of belief. Support is still defined between $65,000 and $65,800, and resistance lies at $67,000 and $70,000, with the price still approaching the lower end of the descending channel.
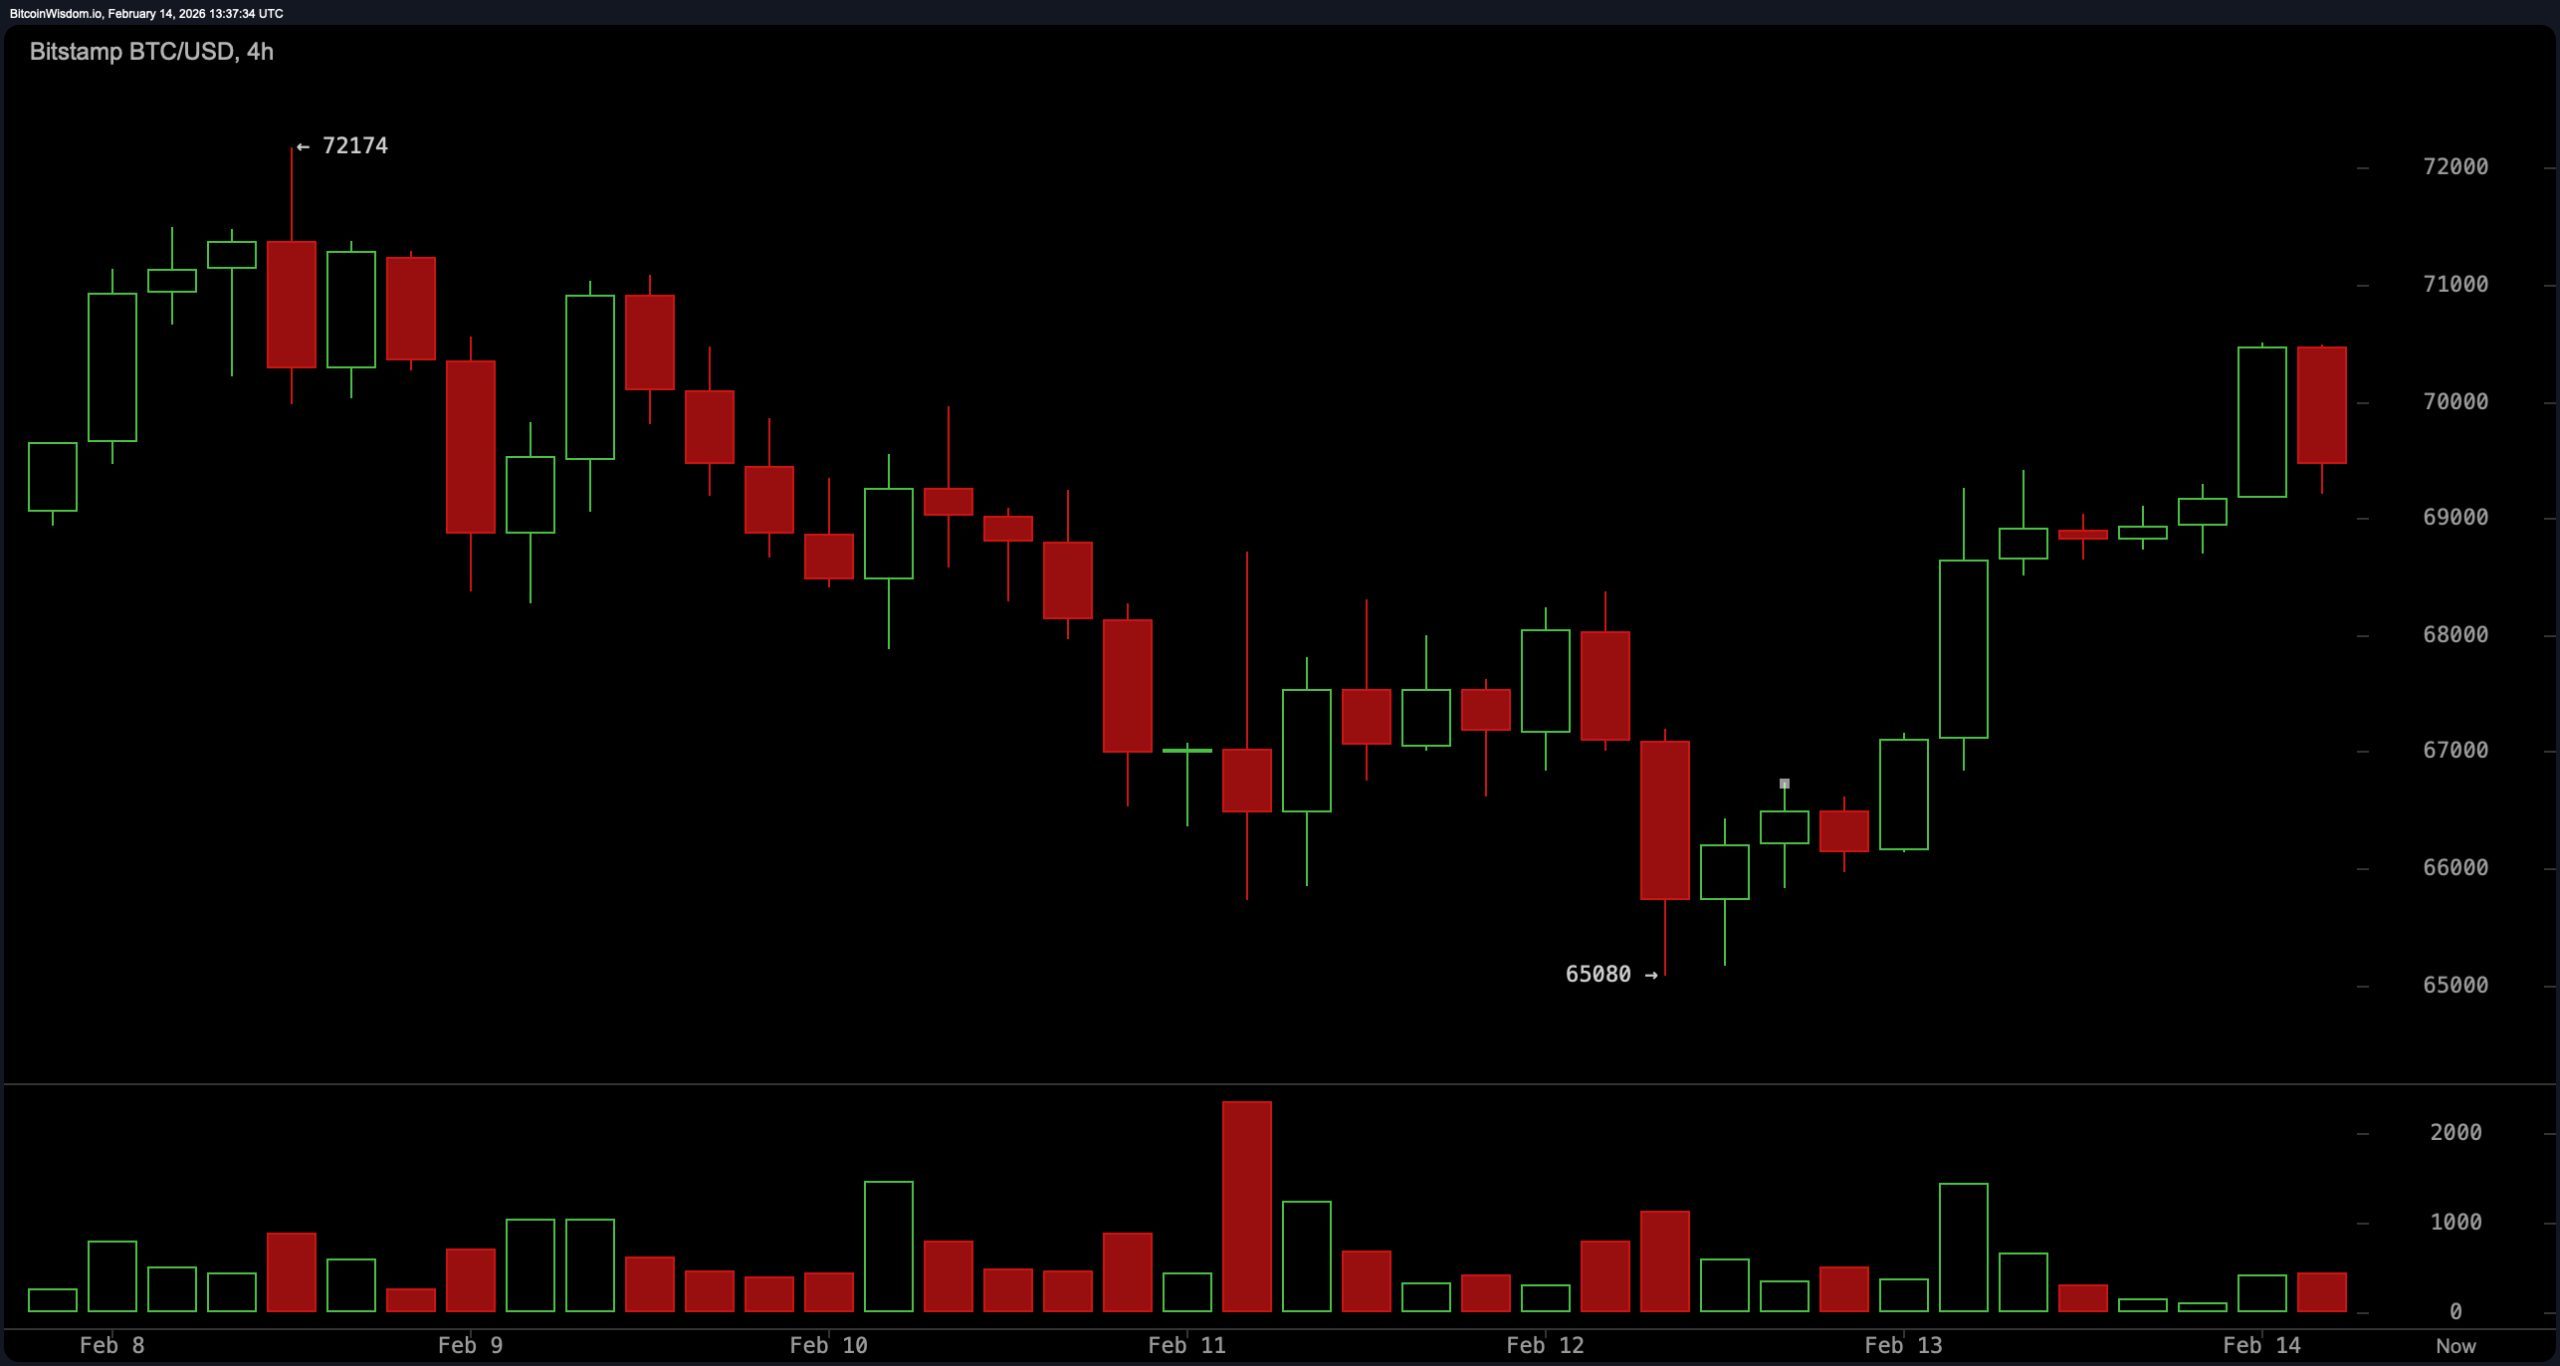
$BTC/USD 4-hour chart via Bitstamp on February 14, 2026.
On the hourly time frame, the volatility is noticeable but not consistent. Bitcoin rallied sharply from $65,628 to $70,513 before forming a double top near $68,000 and reversing towards $66,000. The top around $70,500 showed signs of exhaustion, and the decline in late trading was reflected in a drop in volume below 100 units. Price is still below the daily volume weighted average price (VWAP) near $67,500, and the wedge compression indicates that a directional expansion is near. If the breakout attempt fails, the resistance overhead will further strengthen, leaving the short-term structure vulnerable.
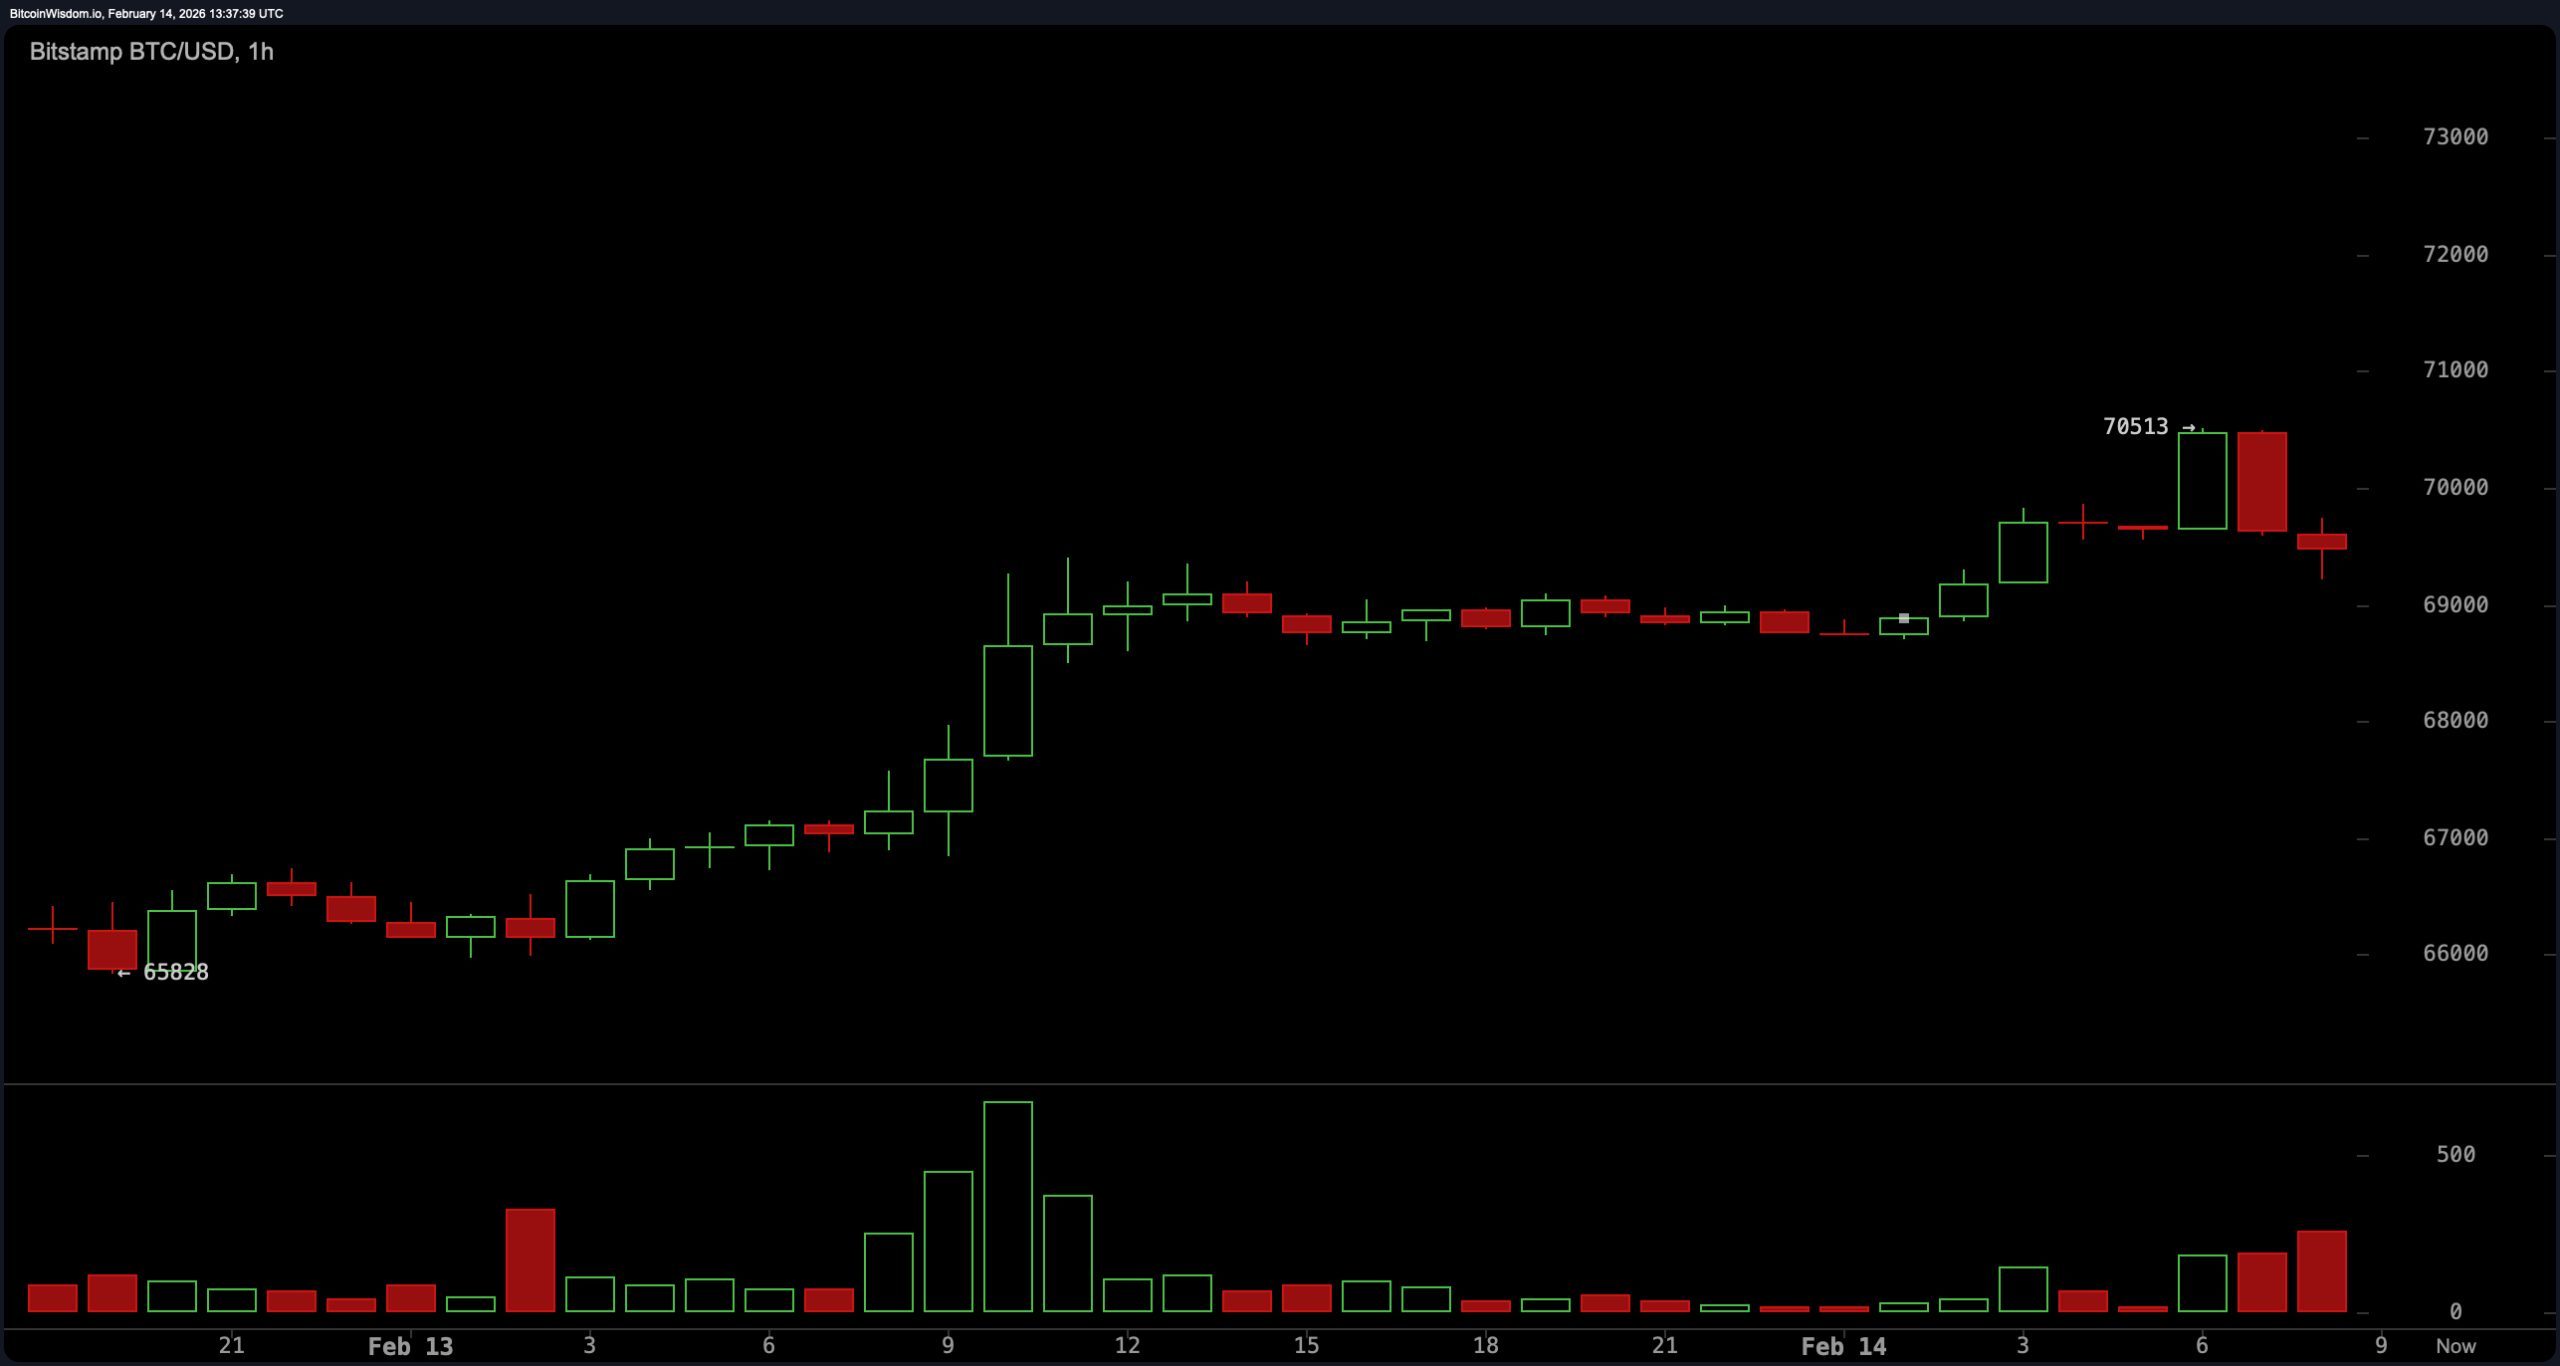
$BTC/USD 1-hour chart via Bitstamp on February 14, 2026.
The oscillator reflects a stabilization but has not yet confirmed a reversal. The Relative Strength Index (RSI) is neutral at 37, with no strong upside expansion and a rebound from oversold territory. The stochastics of 37 reflect this neutrality. The Commodity Channel Index (CCI) of -54 indicates subdued momentum, while the Average Directionality Index (ADX) of 55 confirms the existence of a strong prevailing trend, especially to the downside.
The Awesome Oscillator at -14,028 remains in negative territory and the Moving Average Convergence Divergence (MACD) level at -5,371 continues to reflect bearish momentum. The momentum at -3,555 suggests near-term upward pressure and the possibility of easing within a broader adjustment framework.
The moving average (MA) remains stacked in a bearish direction. Exponential Moving Average (EMA) and Simple Moving Average (SMA) structures show prices trading below almost all major trend gauges. The EMA (10 days) is $70,055 and the SMA (10 days) is $68,326. The EMA (20) is $74,185 and the SMA (20) is $75,066. The EMA (30) is located at $77,404 and the SMA (30) is located at $80,348.
The EMA (50) is $81,619 and the SMA (50) is $84,613. Long-term indicators continue to rise, with the EMA (100) at $88,191 and SMA (100) at $88,023, followed by the EMA (200) at $94,360 and SMA (200) at $100,806. The reality is that Bitcoin remains below its short-, medium- and long-term averages, a situation that continues to constrain upside and intensifies structural overhead pressures.
Bullish verdict:
If $65,000-65,800 holds and volume expands and the price regains $67,000, near-term momentum could build toward $70,000 and challenge $72,000. The oversold recovery signal and reduction in downside volume on the shorter time frame suggest that the bailout rebound is still technically valid.
Bear verdict:
As long as Bitcoin trades below $70,000 and below most of the major moving averages, the broader correction trend will remain dominant. A decisive break below $65,000 would expose downside risks to $60,000, and the structural bias favoring continuation over reversal would remain firmly in place.
Frequently asked questions ❓
- What is the price of Bitcoin on February 14, 2026? Bitcoin is trading at $69,383 with a 24-hour range of $67,098 to $70,434.
- Is Bitcoin currently in a bullish or bearish trend? Bitcoin remains trending toward a short-term correction below major resistance levels and major moving averages.
- What are Bitcoin’s major support and resistance levels? Immediate support lies between $65,000 and $65,800, with resistance tiered at $67,000, $70,000, and $75,000.
- What do Bitcoin technical indicators show? The oscillator shows neutral-to-bearish momentum, and the Moving Average Convergence Divergence (MACD) and multiple exponential moving averages indicate continued downside pressure.