


Ethereum is facing increased volatility after breaking below a key technical level, with traders keeping an eye on resistance zones and divergence signals. Where next?
sharp Ethereum ($ETH) The second-largest crypto asset is under pressure again due to falling prices. $ETH It is down 3.12% in the past 24 hours, trading around $2,011, and the intraday price trend has turned lower as it failed to break above the support between $2,015 and $2,100. The daily range is narrowing towards the downside, suggesting aggressive selling on weakness.
Broader performance indicators are becoming increasingly bearish. Ethereum is down 14.22% over the past week and 34.75% over the past 30 days, with losses deepening to 41.12% over 90 days.
The market cap currently stands at nearly $242.5 billion, with 24-hour spot volume of $4.79 billion and futures volume worth $58 billion. Despite the decline, the long/short ratio is still rising above 2.3 on Binance and 2.5 on OKX.
and $ETH With a decline into a key psychological zone and positioning still long distorted, the market is now facing a crucial question. Does this flash mark the final shakeout before stabilization, or is Ethereum poised for further decline before buyers return?
Will Ethereum become more stable?
On the technical side, Ethereum remains under significant pressure after breaking below the bottom half of its recent range, with the price currently hovering just above the psychological $2,000 area. This zone is currently acting as short-term support, but it is well above the lower Bollinger Band around $1,684, providing the next big downside buffer if selling resumes.
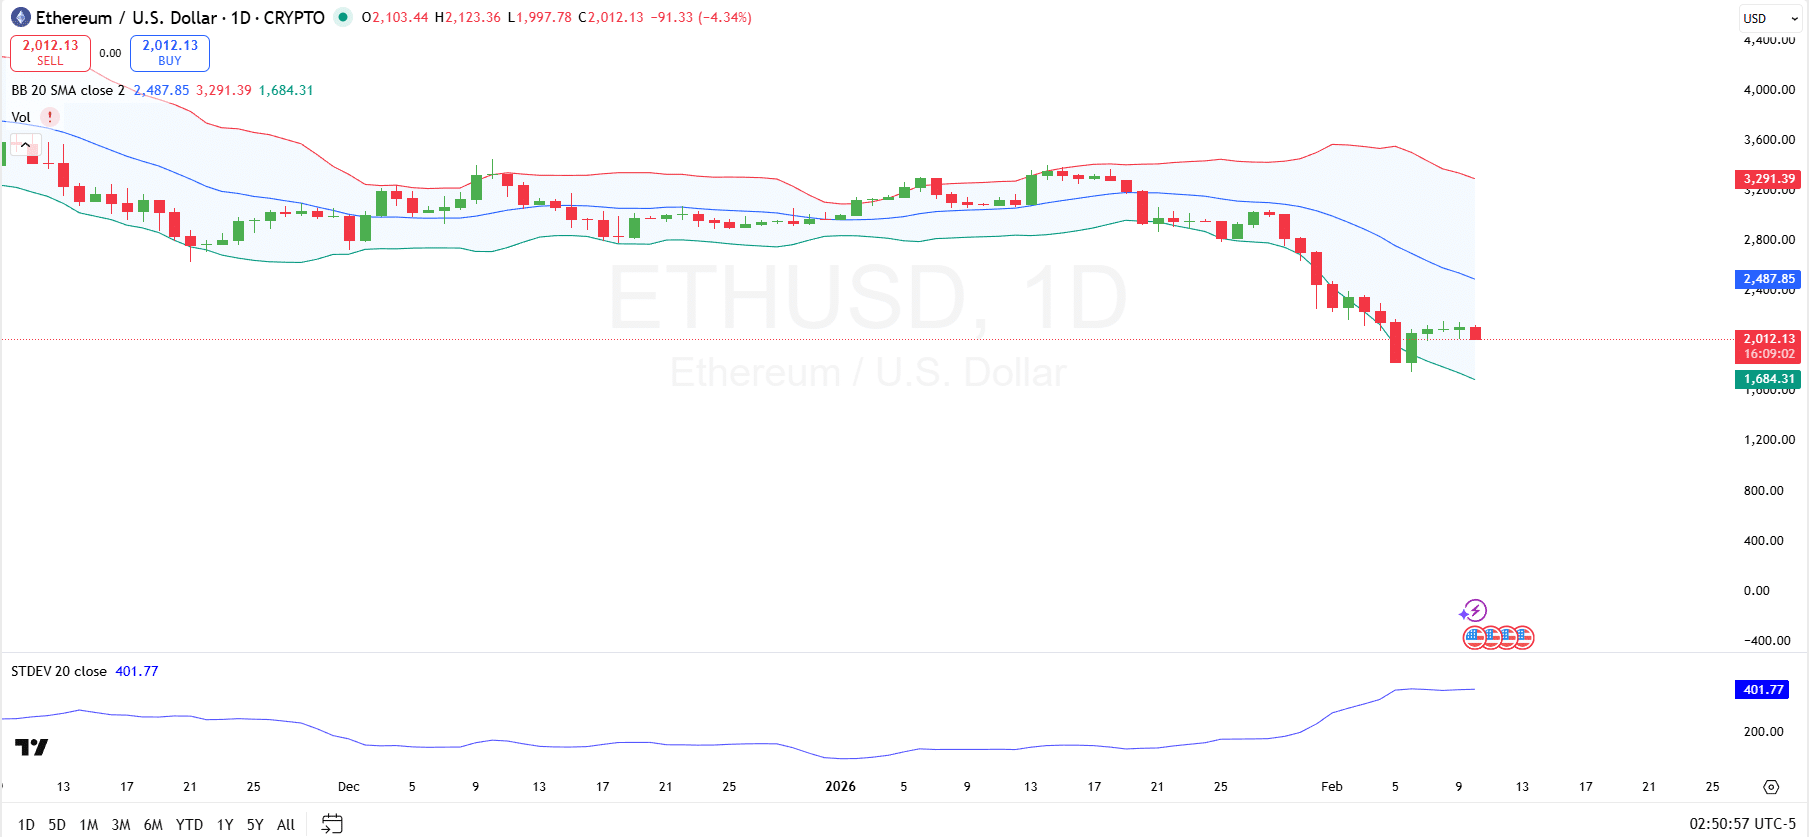
ETHUSD 1 day chart
On the positive side, any attempt at recovery will face multiple layers of resistance. The first major barrier is the 20-day SMA, which coincides with Bollinger’s mid-band around $2,488. This level is a price ceiling many times, defining the line between a correctional pullback and a broader trend change.
Above that, the upper Bollinger Band around $3,291 marks the upper bound of broader resistance, representing the recent extremes of the volatility envelope and a level that sellers were previously actively defending.
Volatility remains high, with the 20-period standard deviation rising to around 401.77, indicating an expansion in price fluctuations. The Bollinger Bands remain wide, confirming that Ethereum is trading in a volatile environment.
Momentum will remain biased to the downside until volatility subsides and price returns to the mid-band. A flattening of the standard deviation and recovery above the 20-day SMA would be the first technical sign that bearish pressure may be waning.
Can Ethereum reach $5,000?
Others include analyst Javon Marks. highlighted A hidden bullish divergence is underway on the Ethereum chart. According to Marks, $ETH Momentum indicators continue to record lows, indicating that below-the-surface downward pressure is easing.

Ethereum predictions
If confirmed, Marks argues, this setup leaves room for a sustained recovery phase, with Ethereum potentially rallying towards the $5,000 region. To reach $5,000 from the current price of $2,011, $ETH It should jump by about 148.6%.