


Bitcoin ($BTC) continues to decline on Monday, February 2nd, trading below the $77,000 level due to a combination of macroeconomic headwinds, institutional outflows, and forced liquidations.
Despite continued volatility, investors are already focused on where Bitcoin will settle by the end of February, and artificial intelligence (AI) models are providing early insight into potential price trajectories amid heightened uncertainty.
Bitcoin AI price prediction
Finbold’s AI-driven price prediction tool aggregates predictions from ChatGPT, Gemini 2.5 Flash, and Claude Sonnet 4 to generate a greater variety of potential Bitcoin price targets. $BTC The price on February 28, 2026 is $76,667.
This figure represents a small change from the current price of $76,784 and suggests that the flagship cryptocurrency will fall by a further 0.14% by the end of the month, which would bring it down to levels not seen since April last year.
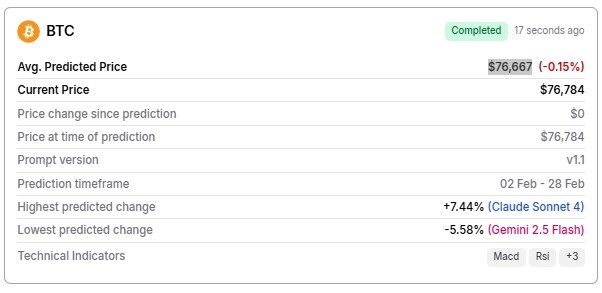
However, average values can be somewhat deceptive. Namely, Claude Sonnet predicted a potential upside of 7.44% and a target price of $82,500. In contrast, Gemini and ChatGPT suggested that Bitcoin could fall by 5.58% to $72,500 or 2.32% to $75,000, respectively.
In other words, the three AI models remain highly divided on Bitcoin’s short-term trajectory, reflecting heightened uncertainty regarding macro policy, institutional positioning, and market liquidity.
Overall, they suggest that ‘digital gold’ is likely to remain range-bound until late February, but individual discrepancies also indicate the potential for volatile movement on the chart, as Claude Sonnet’s aggressive bullish stance balances out the more bearish sentiment expressed by Gemini and Chat GPT.
Bitcoin price outlook for February 2026
Overall, Bitcoin’s decline reflects a self-reinforcing combination of tightening macro expectations, retreat from institutional investors via Bitcoin ETFs, and unwinding of leveraged positions.
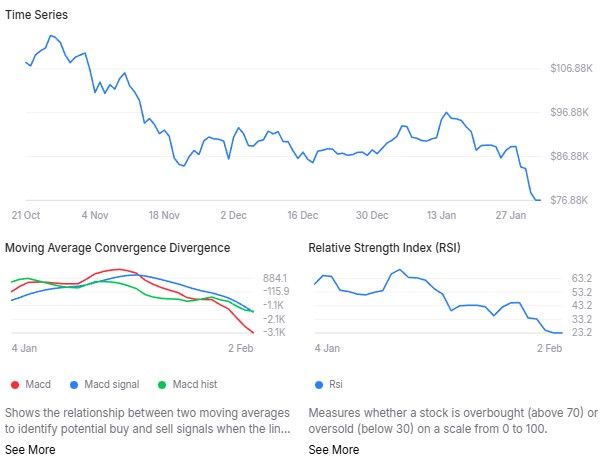
The asset is below key weekly support levels, including the important 200-day simple moving average (SMA) of $103,947, but the 14-day relative strength index (RSI) is 23.37, indicating a significantly oversold situation and weak momentum.
At the same time, the weekly MACD remains significantly negative, with repeated failures around the 0.786 Fibonacci level ($102,700) forming lower highs.
Market participants are currently $BTC A potential signal that selling pressure is easing could be a return to the $78,000 level associated with recent liquidation dominance.
Featured image via Shutterstock