Ethereum remains in a corrective range-bound environment after failing to sustain gains above the mid-$3,000s at the beginning of the month. Price action has been oscillating between a higher timeframe demand cluster near $2,700 and a broad supply band near $3,500, but the major moving averages continue to cap the upside.
This structure leaves directional confidence limited and increases the importance of reactions in nearby support zones during the current pullback.
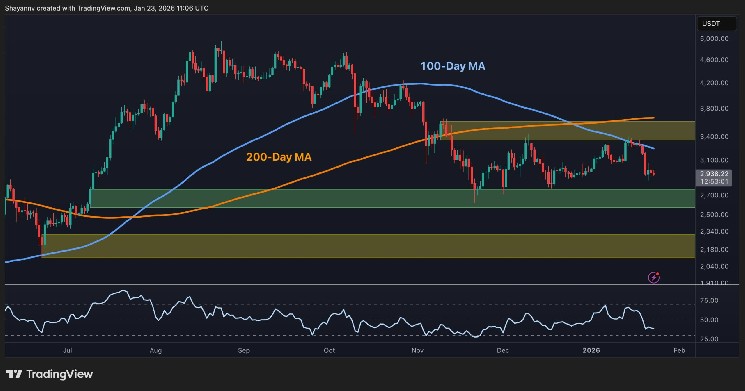
Ethereum Price Analysis: Daily Chart
On the daily chart, Ethereum Rejected once again from the confluence of the $3,500 resistance block and the falling 100-day moving average, the 200-day remains at highs near $3,800, turning sideways. The decline below the 100-day moving average confirms that the main trend remains corrective rather than impulsively bullish, and focus shifts to the green $2,700 demand area as the next key area.
A sustained break above that zone would preclude any bearish continuation and leave open the possibility of another attempt towards the $3,500 mark. On the other hand, a daily close below the $2,700 zone would indicate a deeper mean reversion towards the lower support band around $2,200.

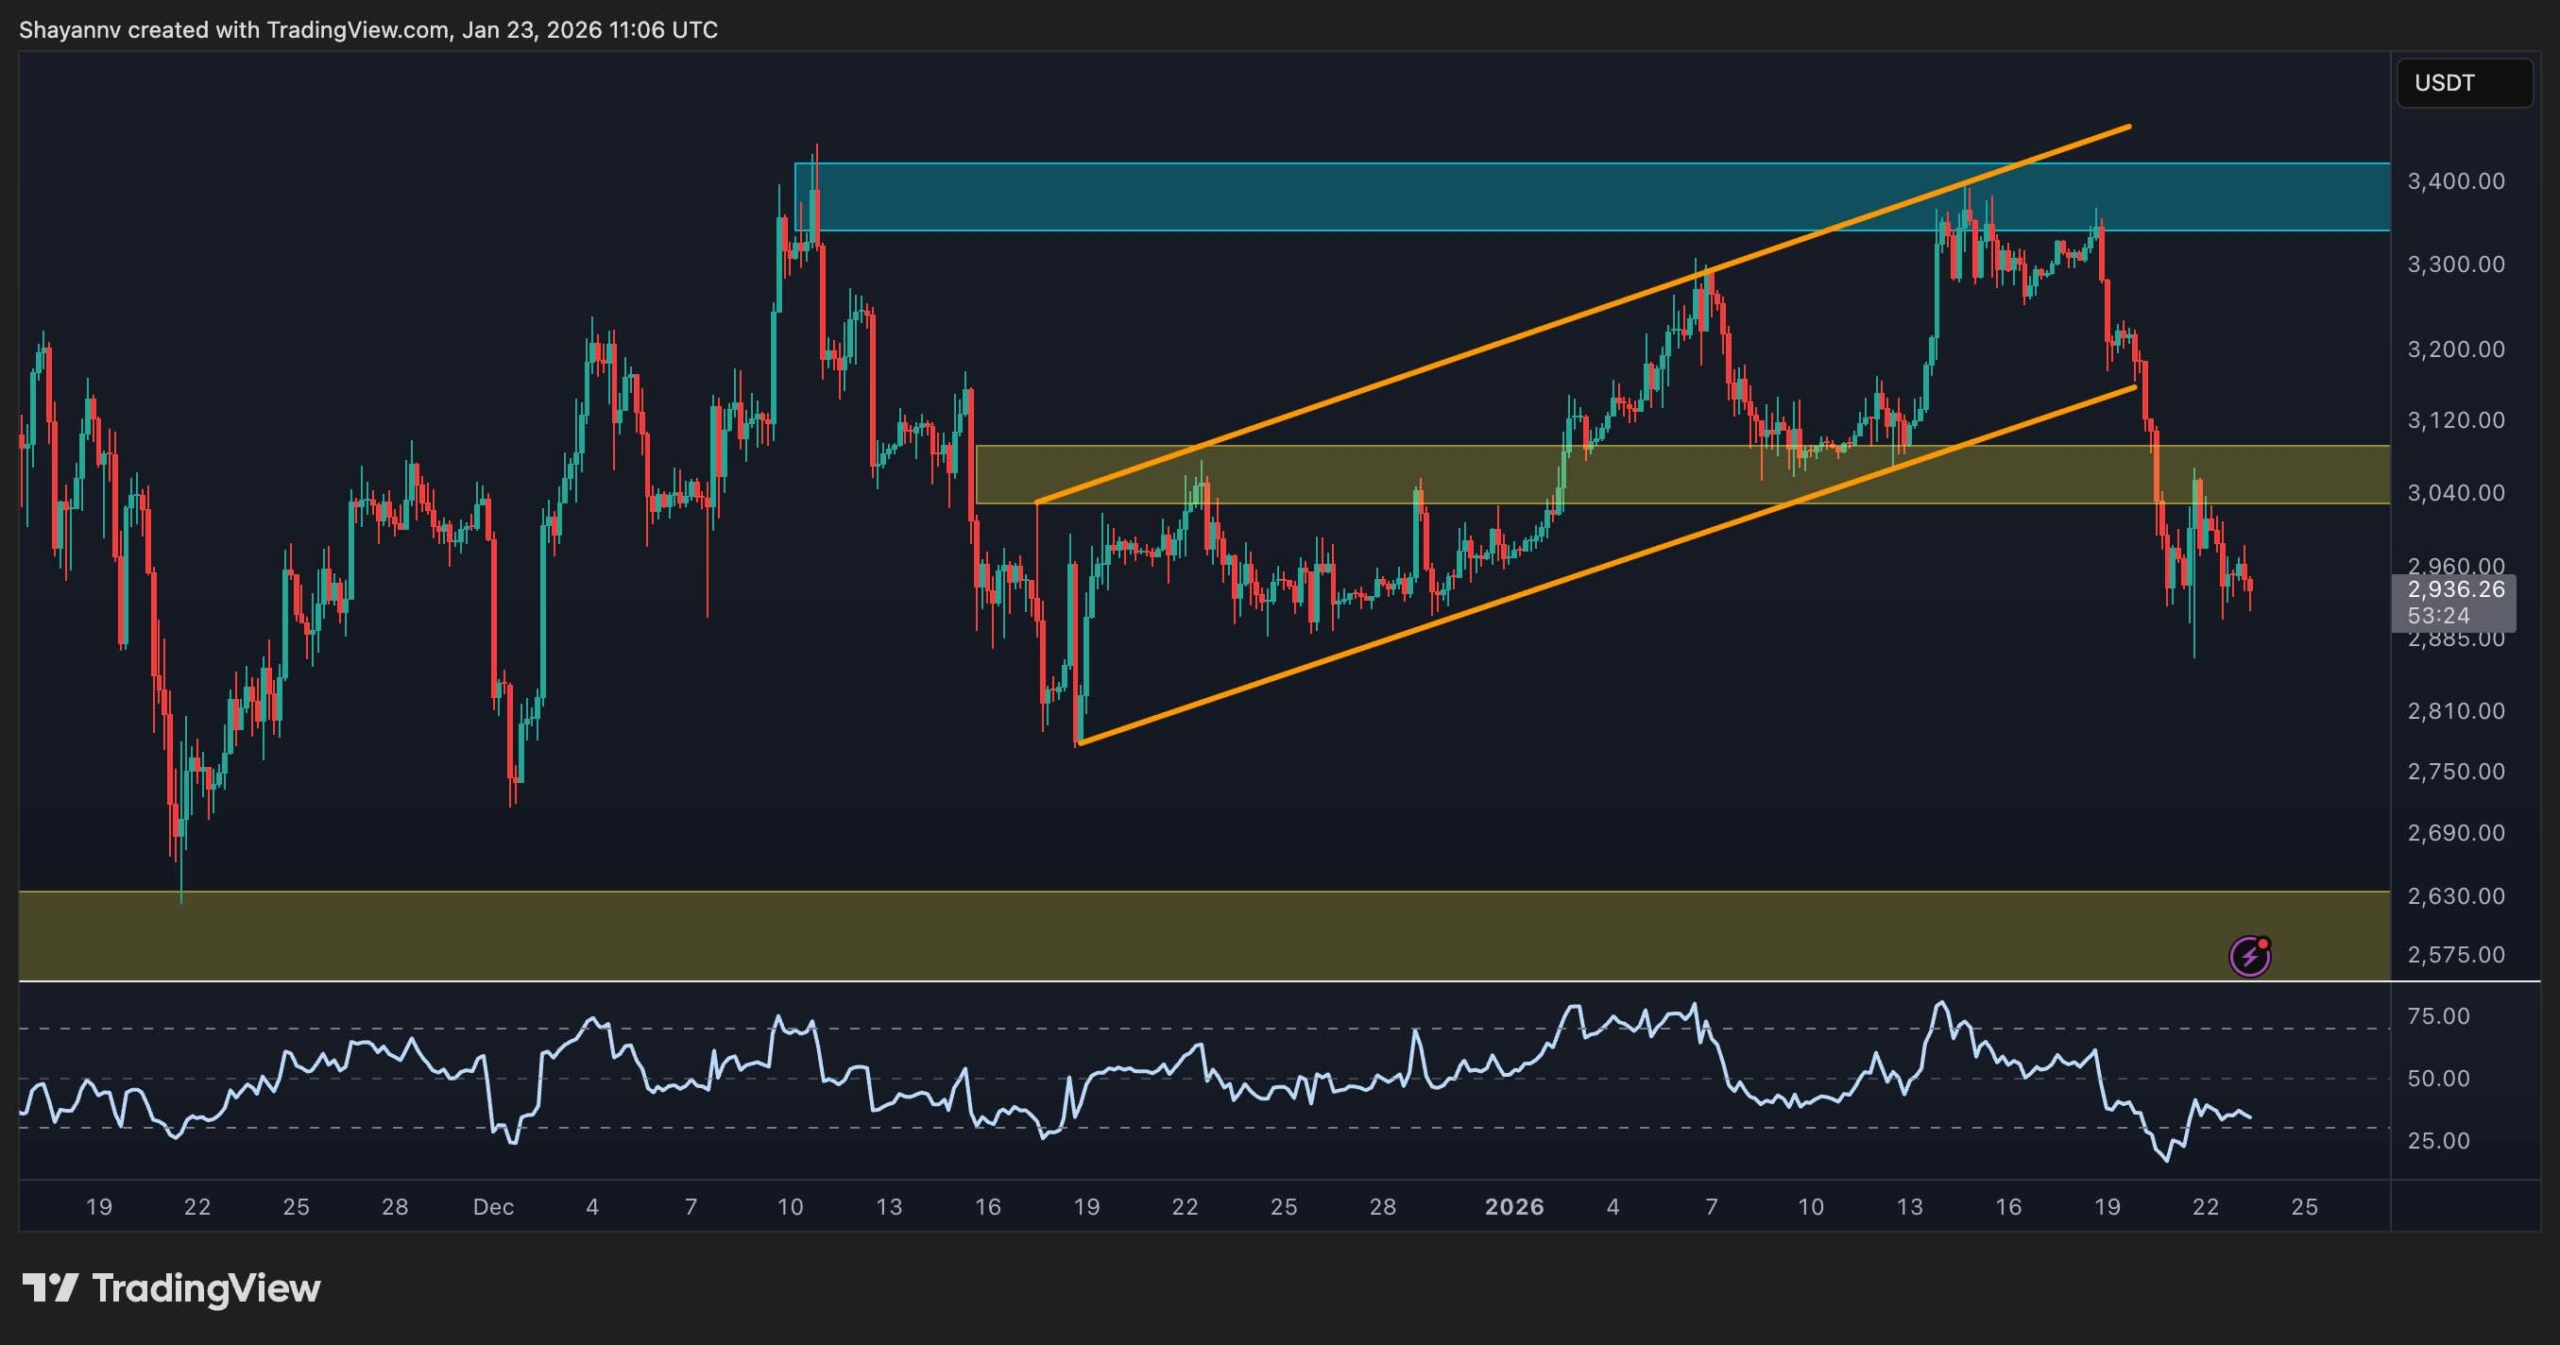
Ethereum/USDT 4 hour chart
The 4-hour chart shows a clear breakdown of the ascending channel that carried the price from around $2,800 to its recent peak near $3,400. After losing the channel floor and local support around $3,000-$3,100; Ethereum is currently trading in a clear downtrend characterized by lower highs and lower lows, with momentum indicators such as the RSI only marginally recovering from oversold territory.
The immediate tactical axis is located near the previous breakdown zone between $3,000 and $3,100. A recovery and consolidation above this area would signal a failure of the collapse and pave the way back to $3,400. On the other hand, if the rejection there continues, we will see pressure on the support level closer to $2,900 and then demand for higher timeframes between $2,600 and $2,700.
sentiment analysis
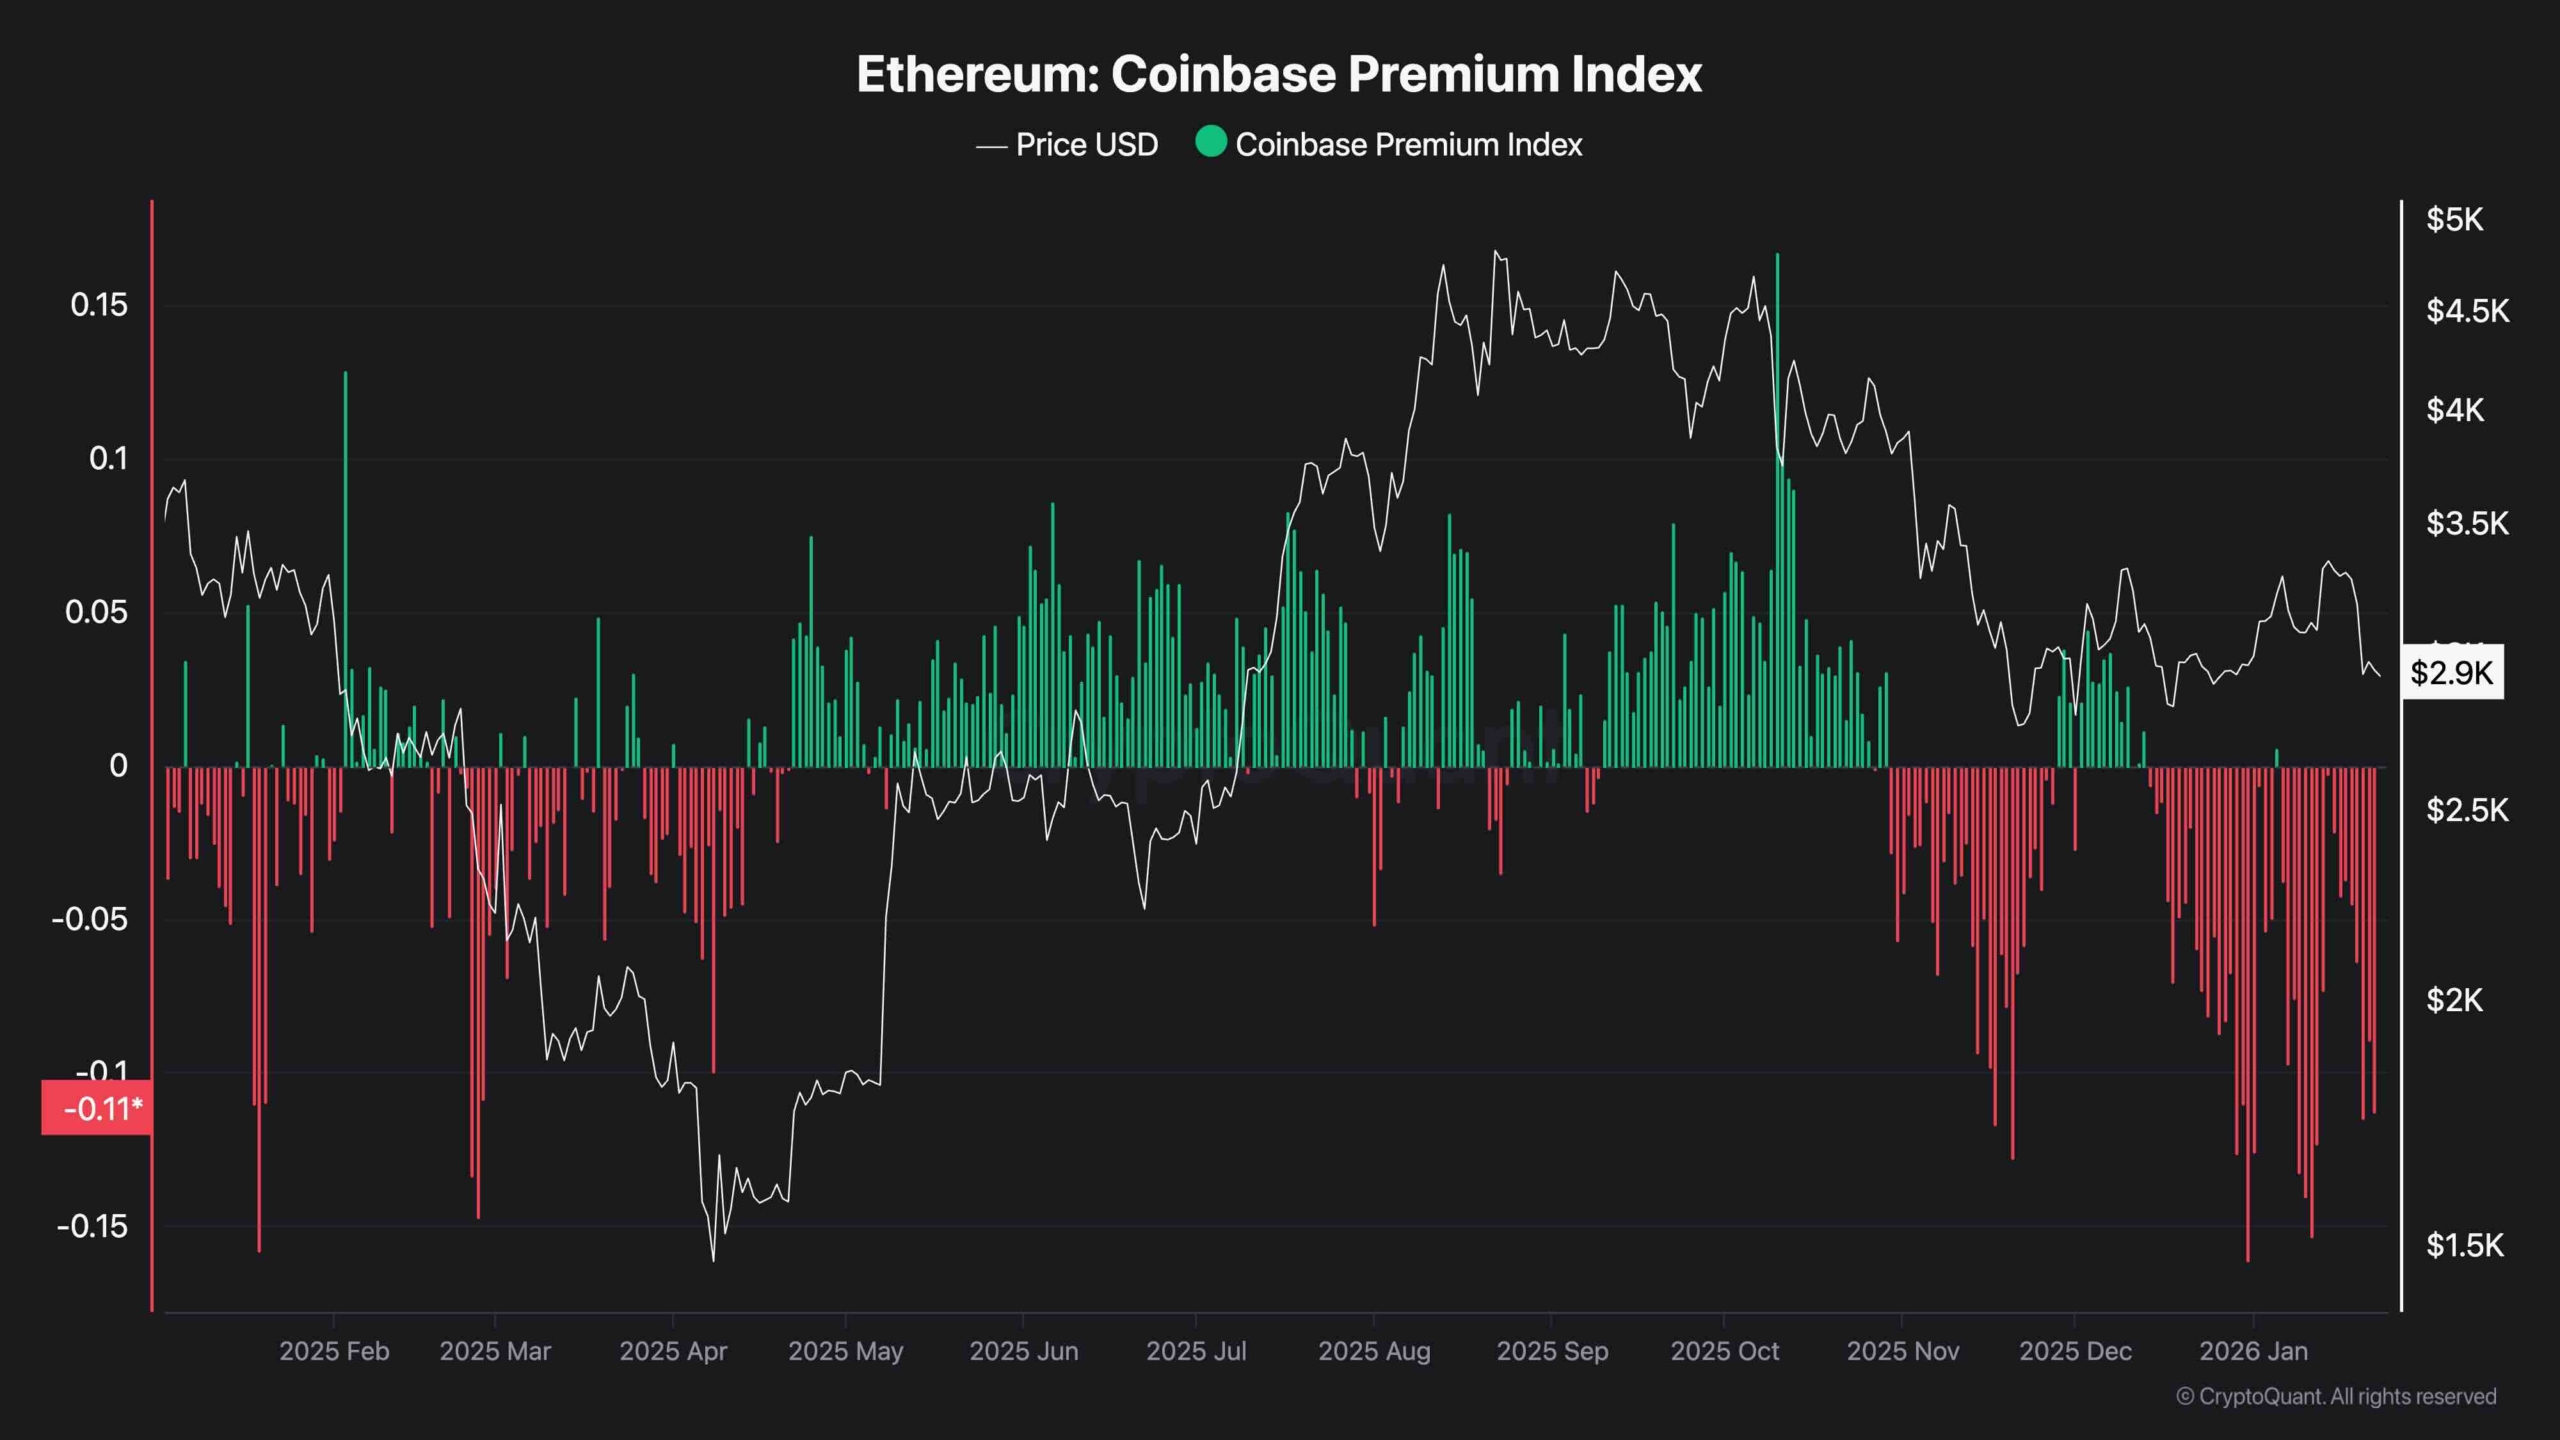
Ethereum’s Coinbase Premium Index has turned decisively negative in recent weeks, and the persistent red numbers indicate that Coinbase’s spot price is trading at a discount compared to Binance. This composition indicates relatively weak buy-side interest from US and institutional-leaning participants, often consistent with distribution stage or cautious positioning in that cohort.
At the same time, the historically widening negative premium may coincide with the depletion of local selling pressure as weaker hands succumb to more aggressive offshore demand, setting the stage for a recovery once macro liquidity and narrative drivers improve. But for now, the continued decline supports the view that the current decline is driven not only by technical rejection at resistance levels, but also by a conservative bias in US spot flows.