


Bitcoin traded between $95,916 and $96,137 per unit as of 9:40 a.m. on January 15, 2026, with a market capitalization of $1.93 trillion and a total 24-hour trading volume of $67.65 billion. This session produced a wide intraday range of $94,887 to $97,704, reflecting increased activity after this week’s aggressive rally. Bitcoin is in consolidation mode as price action remains locked just below recent highs and the market digests gains rather than extending them.
Bitcoin chart outlook
On the daily chart, Bitcoin continues to reflect a broad recovery that started near $84,398 and accelerated towards $97,939. Recent candlesticks have narrowed near resistance, and there are signs of hesitation as price tests the upper bound without definitive follow-through.
Volume expanded during the rally, but then slowed down, a common feature when a market pauses after a strong directional move. Structurally, support is still concentrated between $90,000 and $91,000, but recent highs near $97,939 and the psychological $100,000 level continue to define overhead pressure.
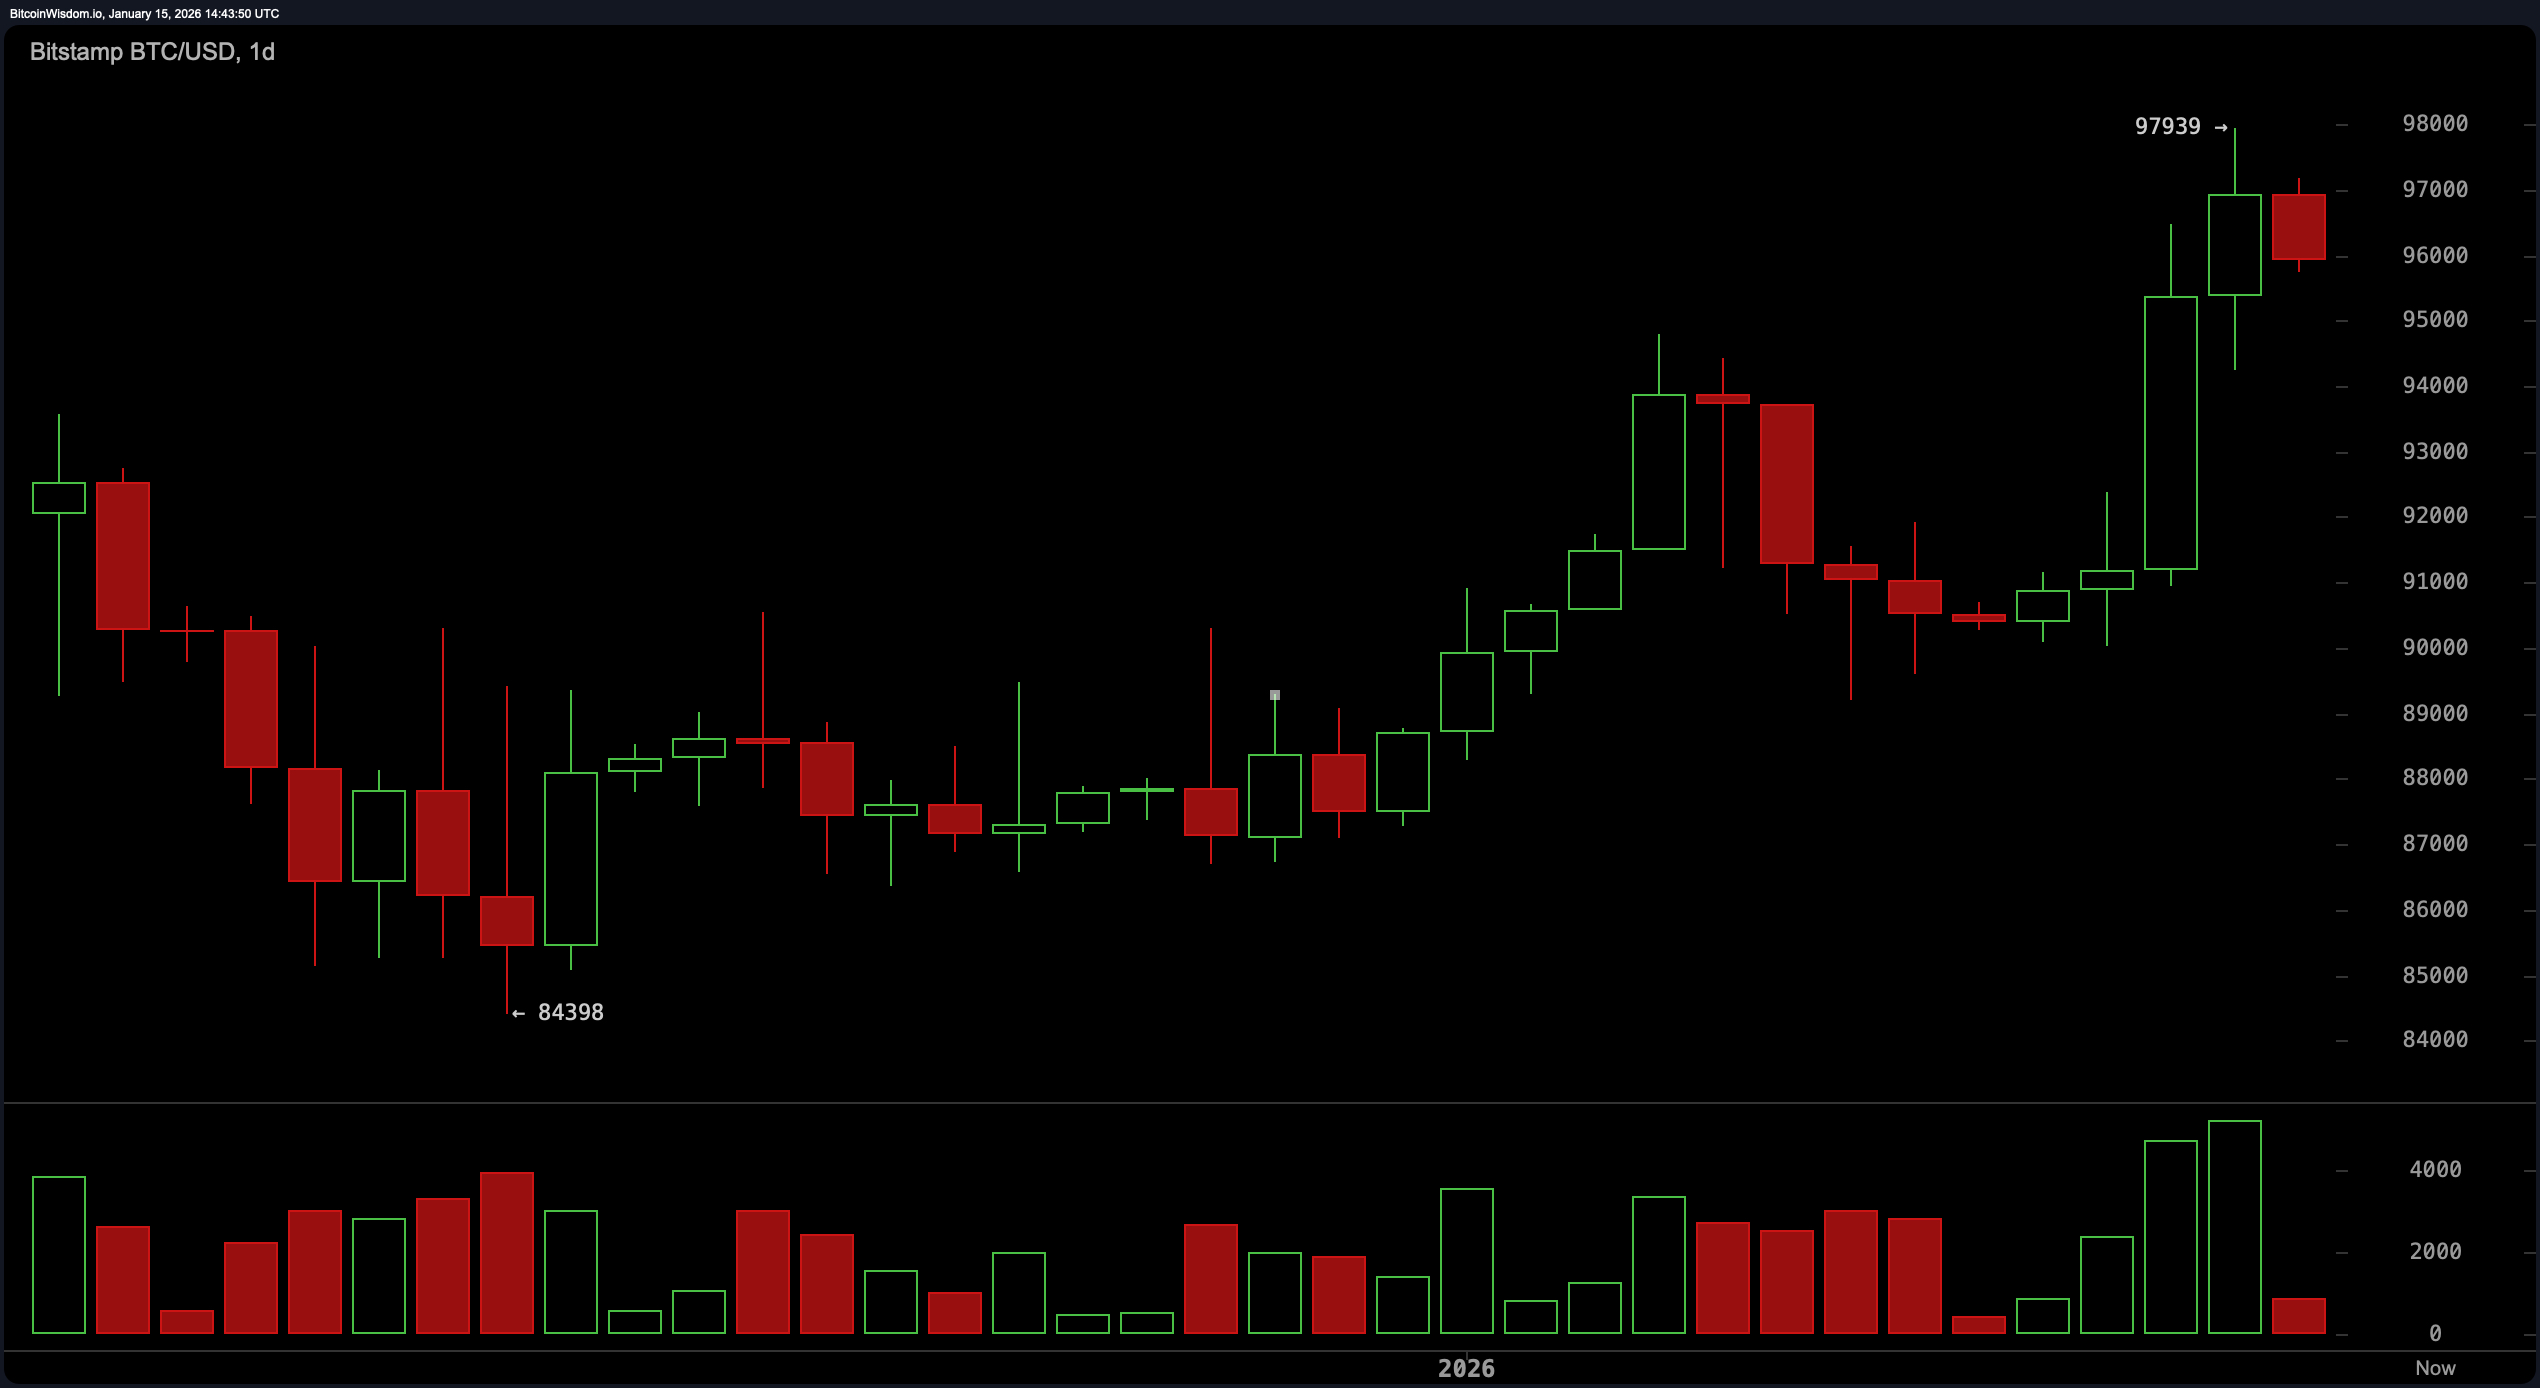
BTC/USD 1-day chart via Bitstamp on January 15, 2026.
The 4-hour chart adds texture to the consolidation story. After a strong breakout that began around January 13, price momentum cooled as Bitcoin rallied to new highs below its recent peak. The volume trend has consistently participated in upswings, followed by a noticeable deceleration as price stalls. This time frame highlights the $94,500-$95,000 area as a key reaction zone where previous demand has manifested, but repeated failures to recover the $97,900 area suggest that the market is reevaluating its short-term direction rather than reversing the trend.
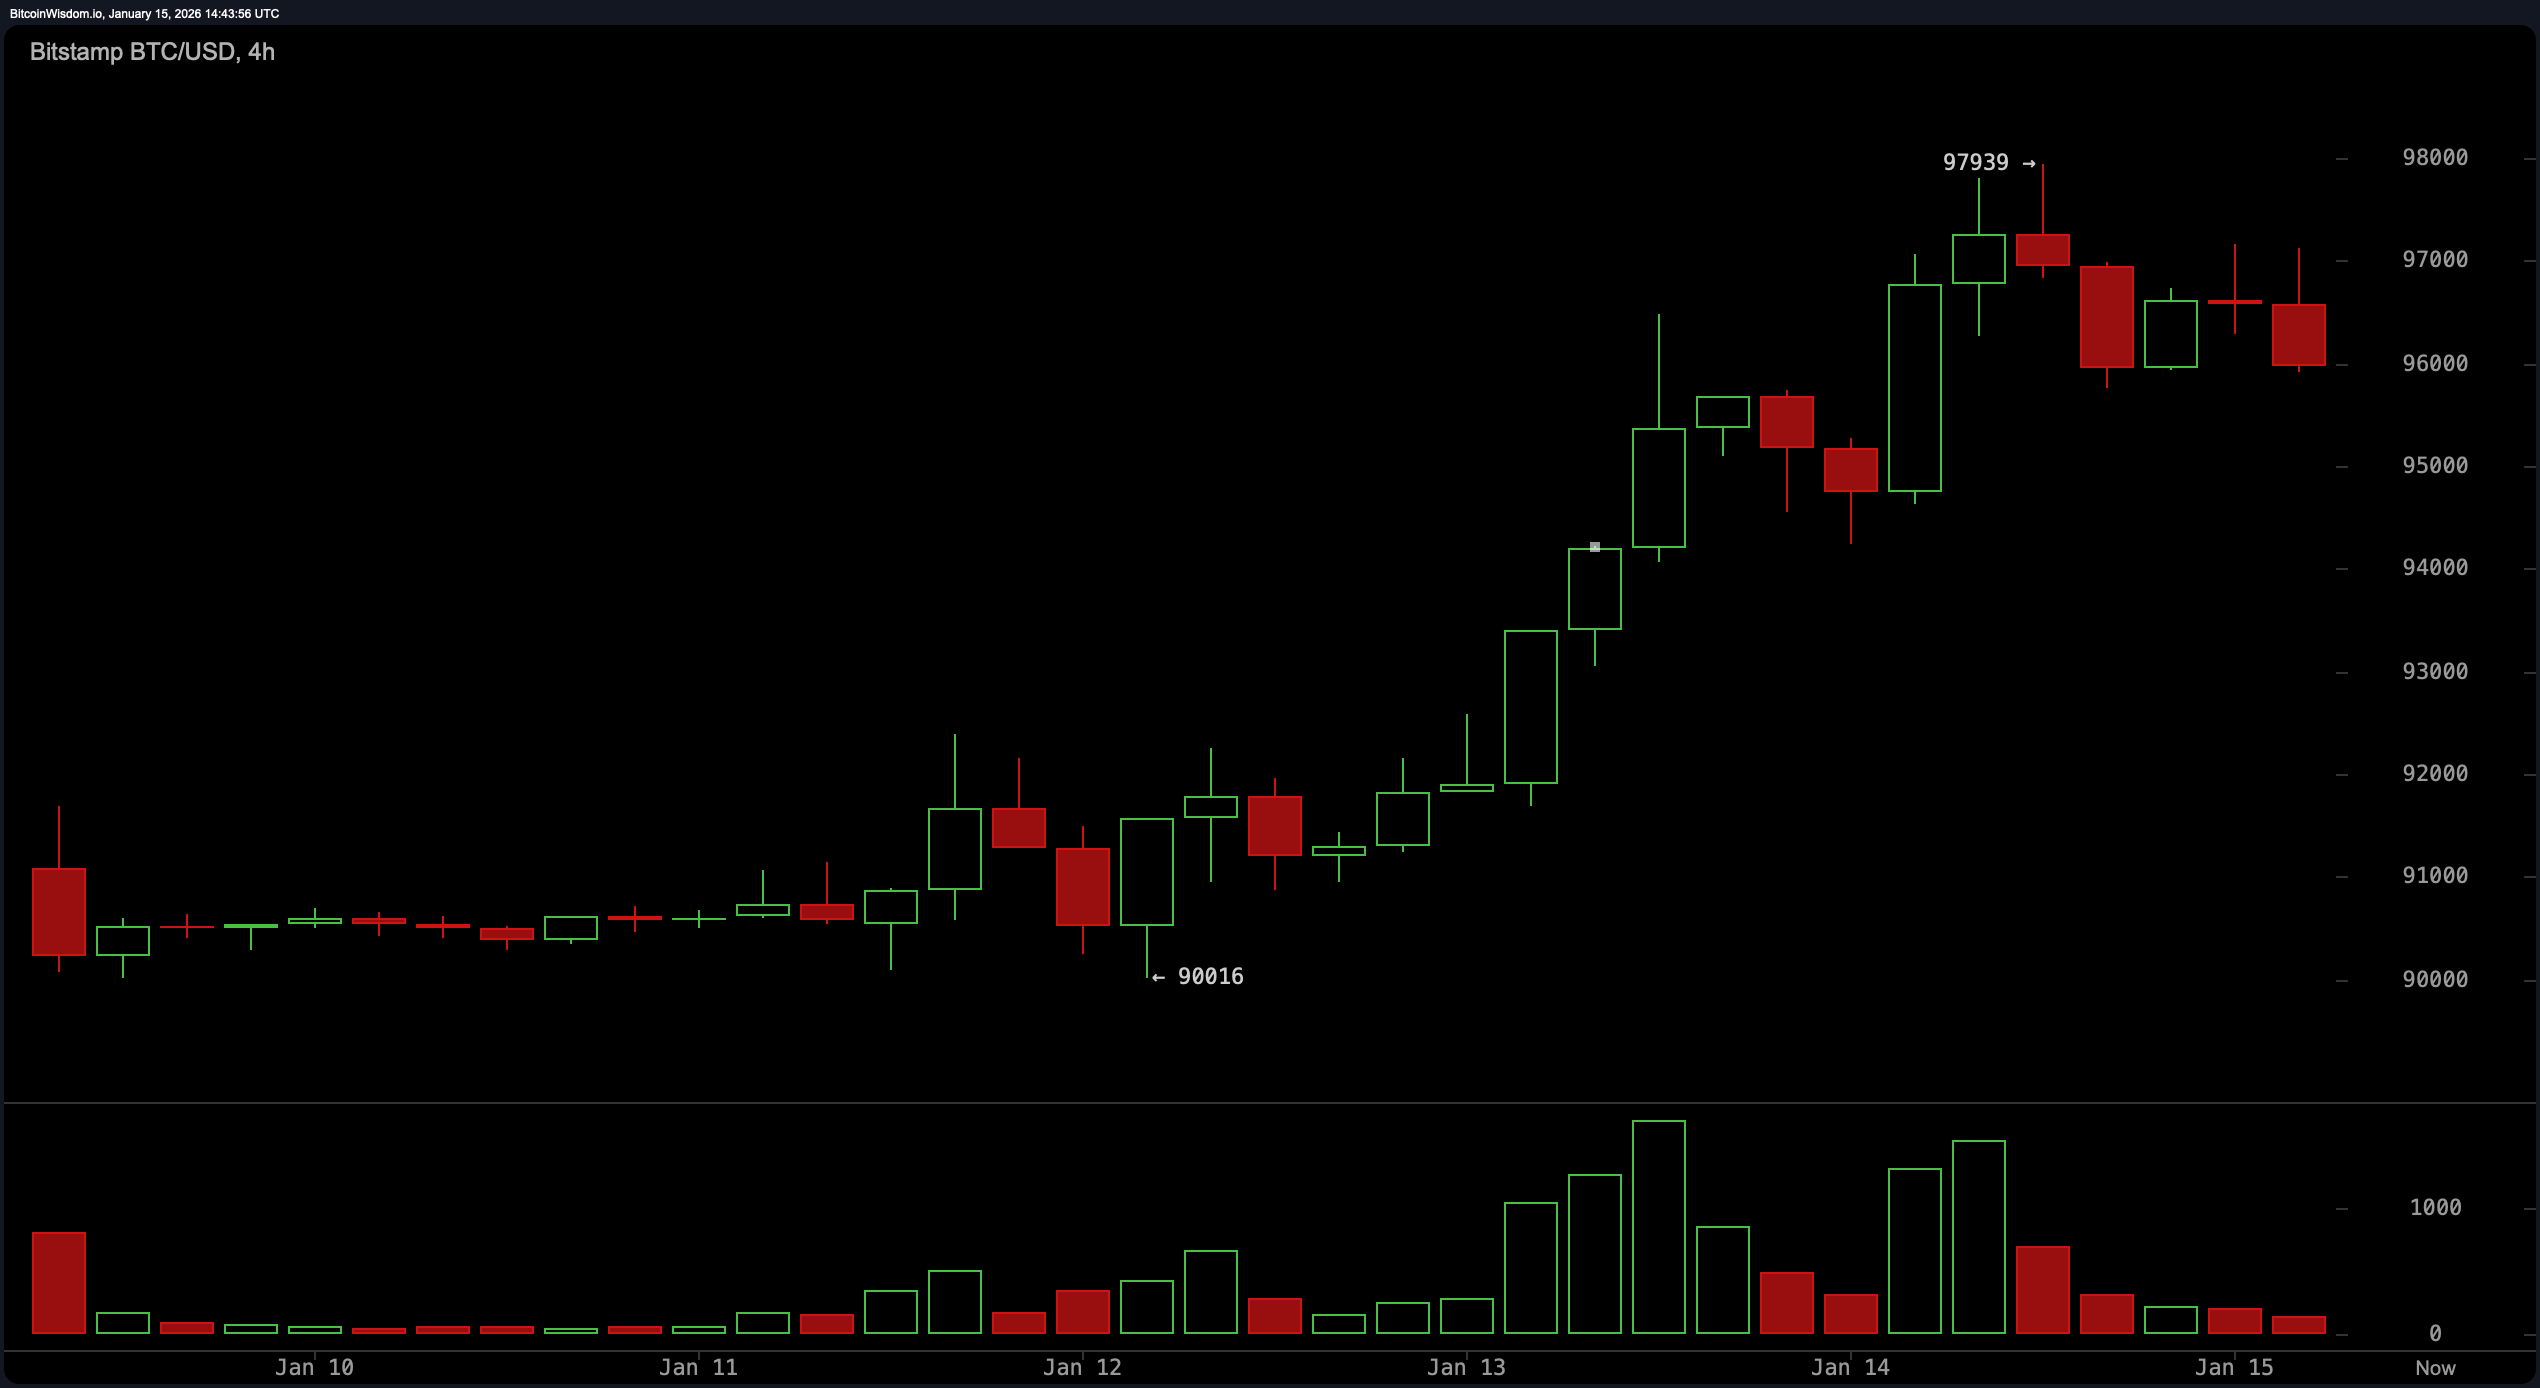
BTC/USD 4-hour chart via Bitstamp on January 15, 2026.
Short-term signals from the hourly chart emphasize compression over conviction. Prices are moving sideways with decreasing volume, indicating a loss of momentum after an earlier rally. This structure is similar to a consolidating band, with $96,500 acting as a near-term inflection point. Below that level the pressure can tip downward within that range. Conversely, new strength above $97,200 could be seen as an indication that short-term participants are re-engaging, although a meaningful return would be needed to confirm that.
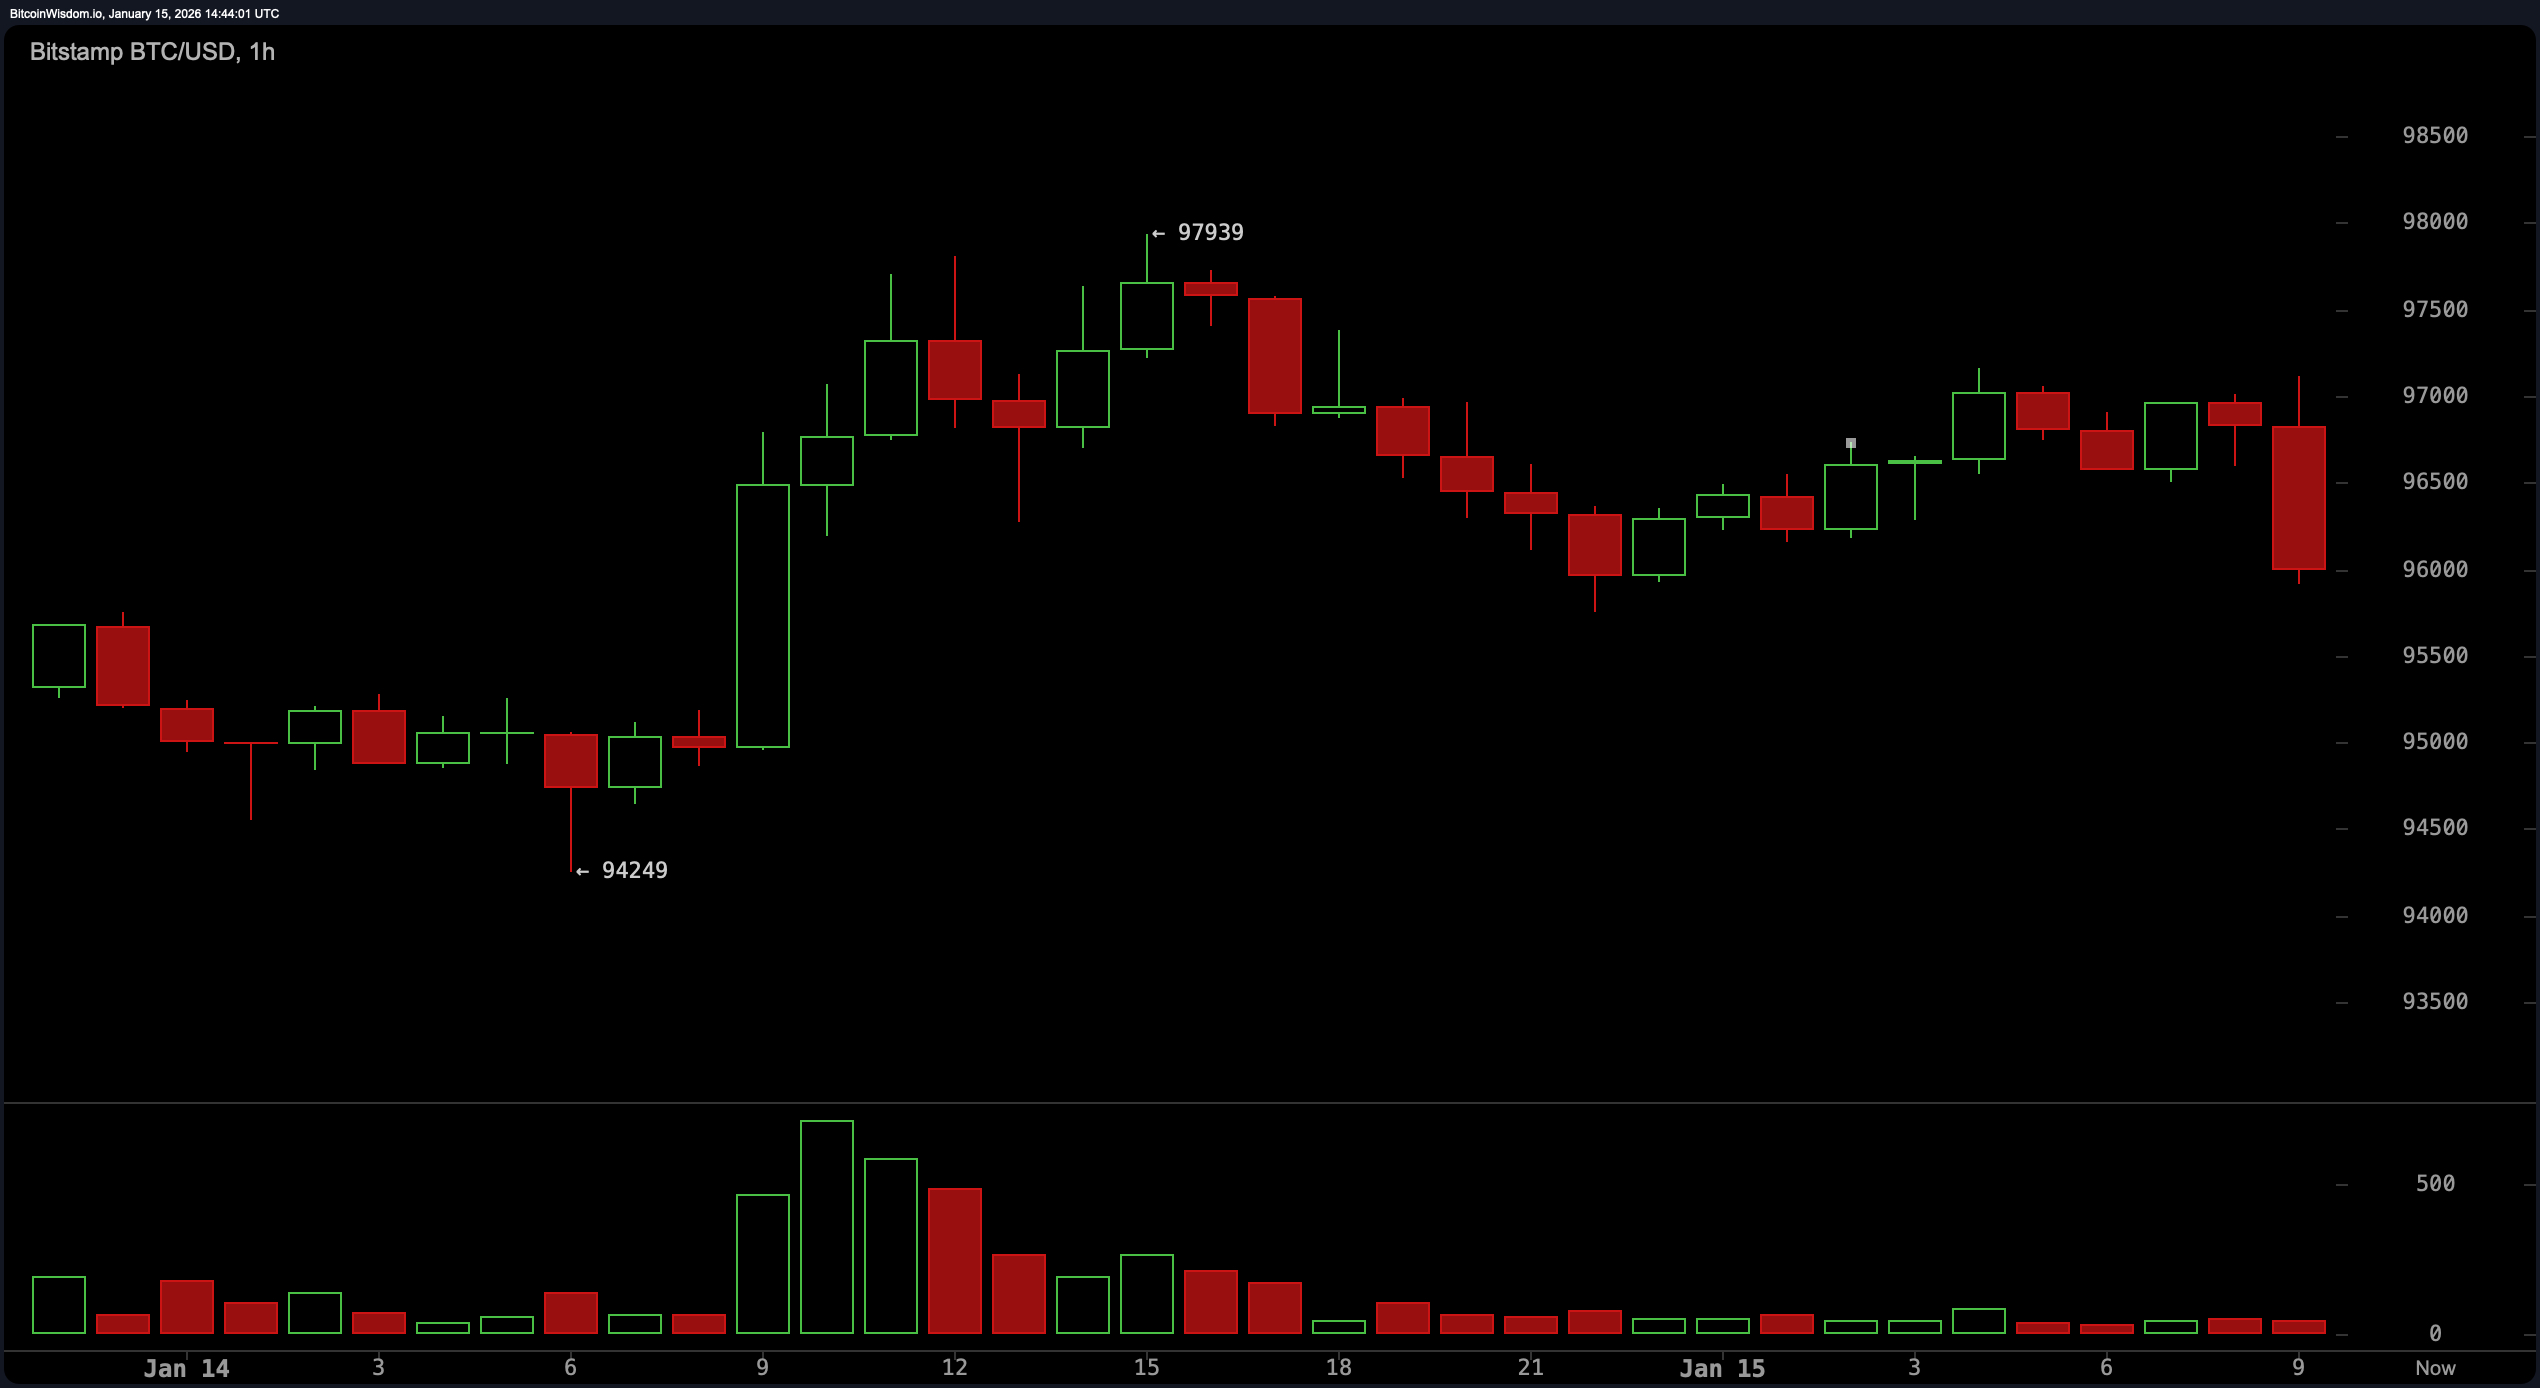
BTC/USD 1-hour chart via Bitstamp on January 15, 2026.
The oscillators present a mixed but consistent picture. The Relative Strength Index (RSI) of 69 and the Stochastic of 89 both show neutral readings, reflecting a less extreme but elevated situation. The Average Directional Index (ADX) of 32 confirms the existence of a trend without acceleration, while the Awesome Oscillator of 3,966 remains neutral. At the same time, the Commodity Channel Index (CCI) of 182 and Momentum (10) of 2,900 indicate a stretched situation after the rally, even though the Moving Average Convergence Divergence (MACD) level of 1,476 maintains a positive bias. Taken together, these measures suggest that momentum is slowing, but not disappearing.
Moving averages reinforce broader trends while highlighting overhead friction. Short-term indicators such as the 10-50 period Exponential Moving Average (EMA) and Simple Moving Average (SMA) continue to trend upwards and continue to support prices. The exponential moving average (100) at $96,011 is still consistent with the general uptrend, while the simple moving average (100) at $97,092 is closer to the current price and acts as short-term resistance. Long-term pressure is evident at the $99,563 exponential moving average (200) and the $106,010 simple moving average (200), reinforcing the idea that Bitcoin is consolidating below a heavier technical ceiling rather than accelerating unchecked.
Bullish verdict:
Bitcoin’s broad structure remains constructive, with the price well above major support zones and short-term exponential and simple moving averages continuing to trend upwards. Consolidation below recent highs suggests consolidation rather than deterioration, and while momentum indicators are increasing, they are not definitively bucking the general trend. The technical backdrop favors continuation after this pause as long as prices are supported above the mid-$90,000s.
Bear verdict:
The failure to conclusively clear recent highs near $97,900, combined with growth in cooling and oscillator readings, leaves Bitcoin vulnerable to a deeper downturn. Long-term moving average overheads remain under pressure, and a breakdown below short-term support is likely to lead to increased downside exploration into the low-demand zone. In this scenario, the market would be showing exhaustion, not just hesitation.
Frequently asked questions ❓
- What is the price range of Bitcoin on January 15, 2026? Bitcoin was trading at $96,137 as of 9:40 a.m. ET, with an intraday range of $94,887 to $97,704.
- Why is Bitcoin consolidating around $97,000? Technical indicators indicate that momentum is weakening after a rapid rise, prompting a sideways price movement near the resistance level.
- Which level is most important for Bitcoin right now? Support is located near the mid-$90,000 zone, while resistance lies just below $98,000 and near $100,000.
- What do the indicators suggest about Bitcoin’s near-term outlook? The oscillators and moving averages are showing consolidation rather than a confirmed trend reversal.