


Ethereum price gains lost momentum this week, rising from a January 13 high of $3,387 to the current $3,288 as concerns over the market structure bill mount.
summary
- Ethereum Prices have fallen in recent days as demand for cryptocurrencies has declined.
- Ethereum has promising fundamentals, including increased network activity.
- The token has formed an ascending wedge chart pattern on the daily chart.
Ethereum (Ethereum) token has fallen 33% from its all-time high last August, reflecting the performance of the broader cryptocurrency market.
The token has fallen despite its strong fundamentals. For example, the Spot Ethereum ETF has added more than $584 million in inflows this year, bringing cumulative net inflows to more than $12.9 billion, according to data compiled by SoSoValue. All of these funds have more than $20 billion in assets, and BlackRock’s ETHA has more than $11.7 billion in assets.
The Ethereum network is also doing well, with the number of transactions and users continuing to grow. Over the past 30 days, the number of transactions has increased by 30% to over 58 million, and active addresses have increased by 64% to 13.1 million.
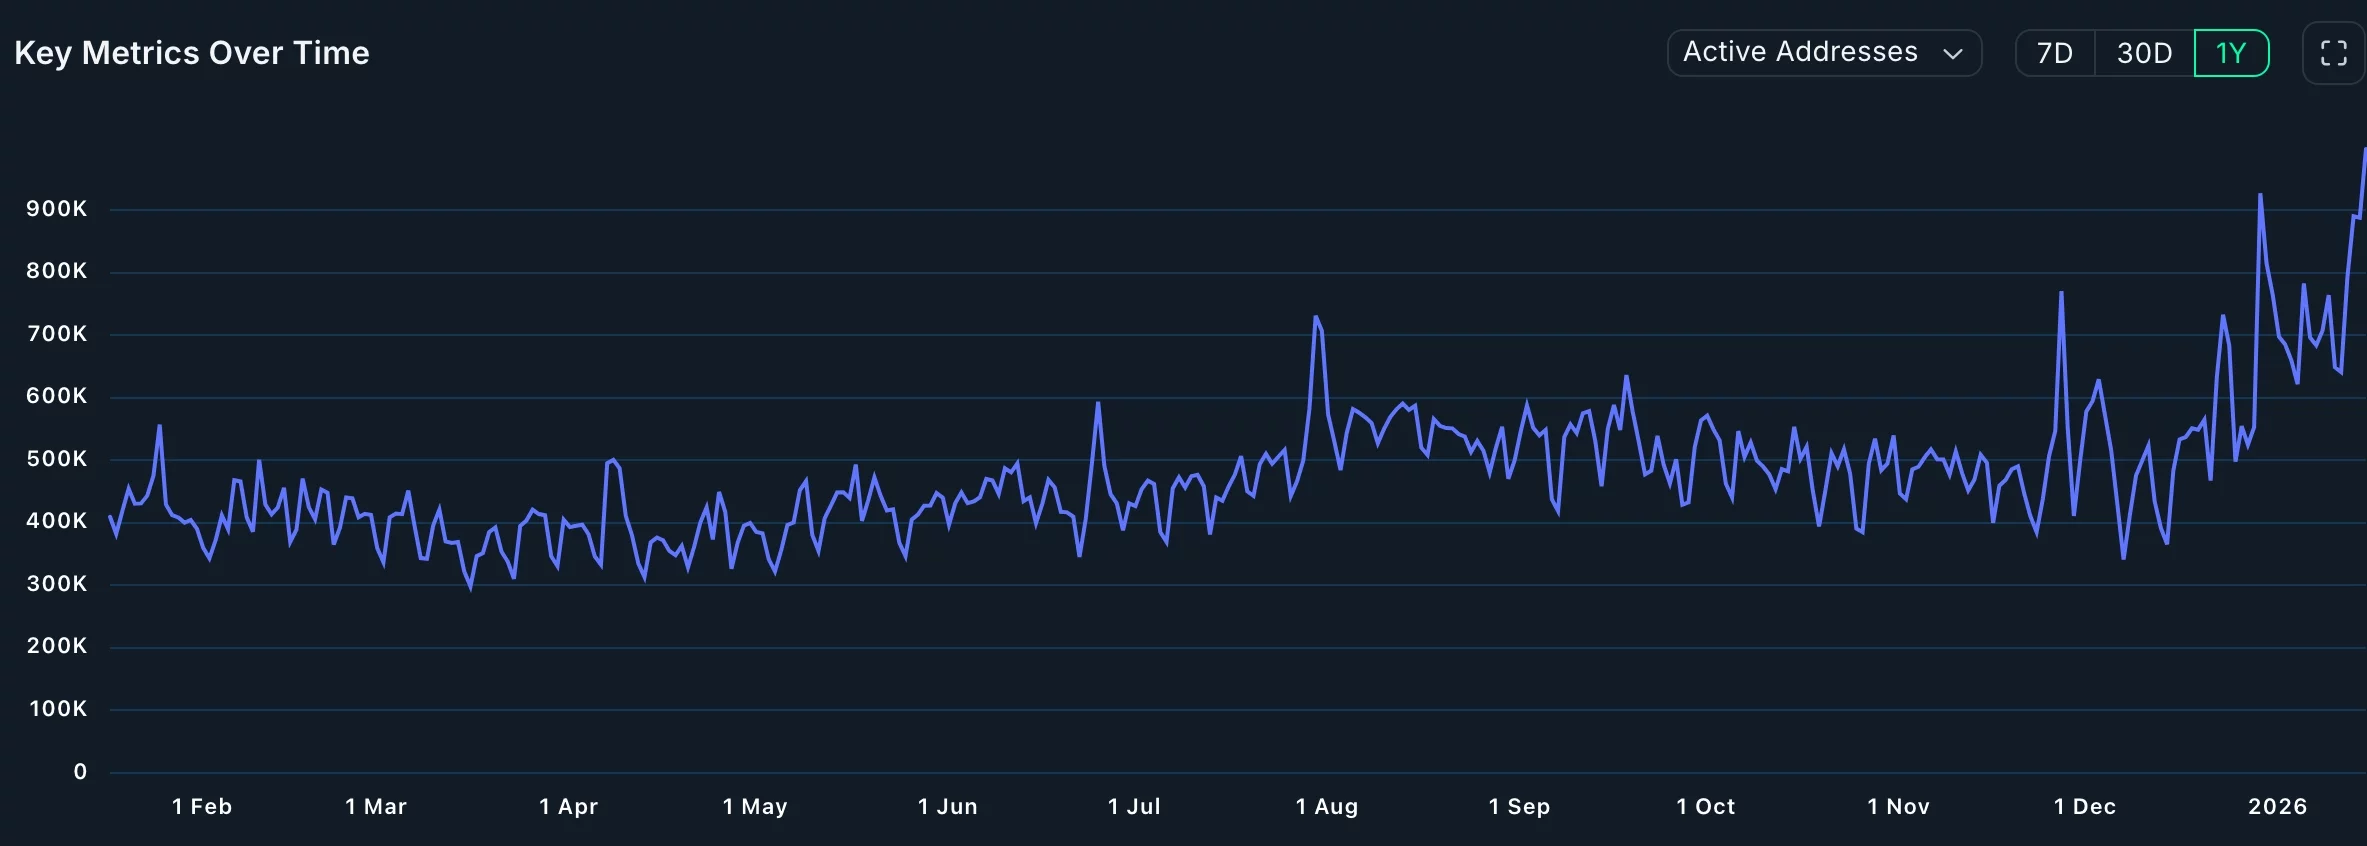
Ethereum active addresses |Source: Nansen
Ethereum stablecoin transactions have continued to surge this year, with the supply of these tokens increasing to $170 billion and trading volume to $977 billion in the past 30 days. The network’s stablecoin transactions increased to more than 50.4 million.
You may also like: Monero price eyes $930 as Fibonacci extension breakout continues
Further data shows that Ethereum investors moving around staking pools are earning around 2.85% in annual returns. According to the data, the staking market has increased by $1 billion in the past 30 days, surging to more than $118 billion. BitMine continues to stake its massive Ethereum assets, and this is a bullish stance.
Ethereum price technical analysis
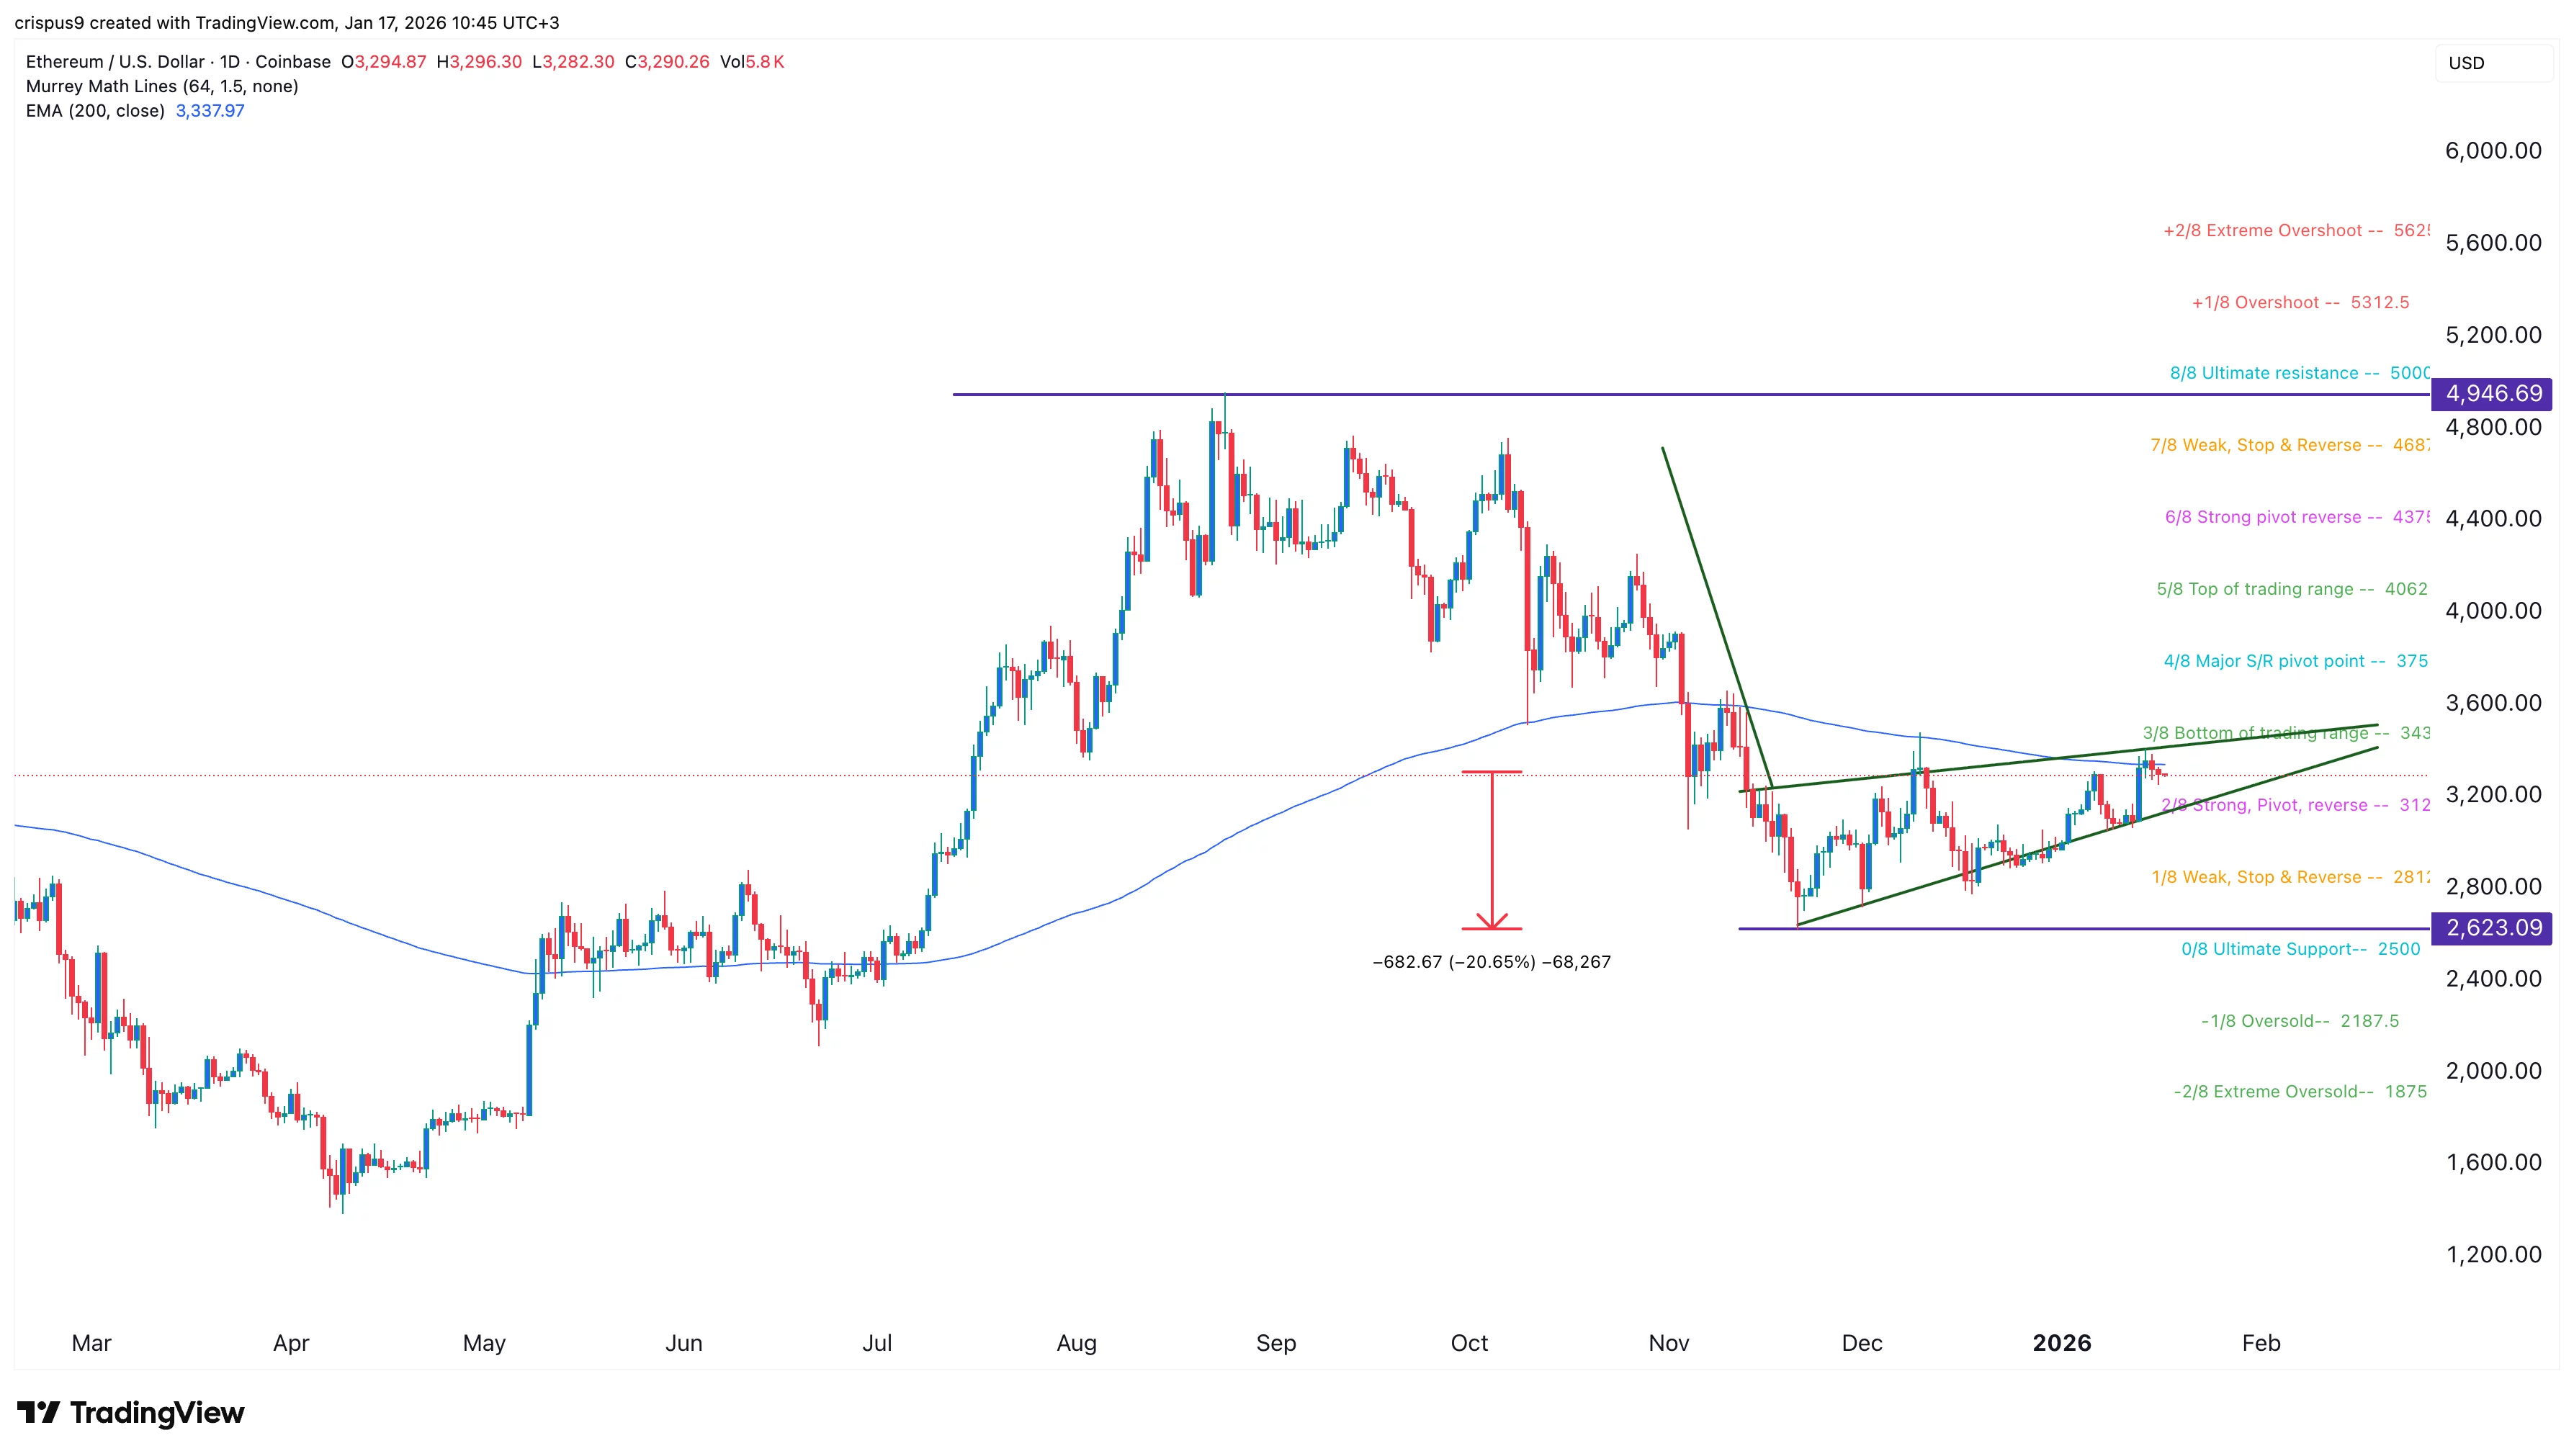
Ethereum Price list |Source: crypto.news
The daily timeframe chart shows Ethereum price retreating from last year’s high of $4,946 in August to the current $3,290. The price failed to break above the 200-day exponential moving average, indicating that the bulls are losing momentum.
The token has formed an ascending wedge pattern, which is characterized by two rising and converging trend lines. The wedge is one of the most common bearish reversal patterns.
It also formed a bearish pennant and bearish divergence pattern. Therefore, the coin could make a strong bearish breakout to the November 21st low level, a key support level at $2,623. This target is approximately 20% lower than current levels.
Conversely, a move above the key resistance level at $3,500 would invalidate the bullish outlook and point to further upside.
You may also like: NFT buyers increase 120% despite sales flat at $61.5 million