


Ethereum continues to trade in a weak structure as the entire market leans into a defensive position. After rebounding slightly from the current cycle low of $2,659, the price is hovering around $2,900.
The market is showing hesitation as futures trading cools, spot flows remain negative and institutional investors increase exposure. As a result, traders are now tracking whether ETH can stabilize before a deeper drawdown challenges the next support cluster around $2,500.
Market structure remains weak below dynamic resistance
ETH is still forming clear highs and lows on the medium-term chart. Price is still below the 9-EMA, indicating weak momentum despite the recent rally.
In addition, a retest of short-term resistance near $2,886 continues to limit any attempt at a meaningful recovery. A close above this area could pave the way to $3,166, where structural resistance coincides with the 0.236 Fibonacci zone. Until then, broader trends are alarming.
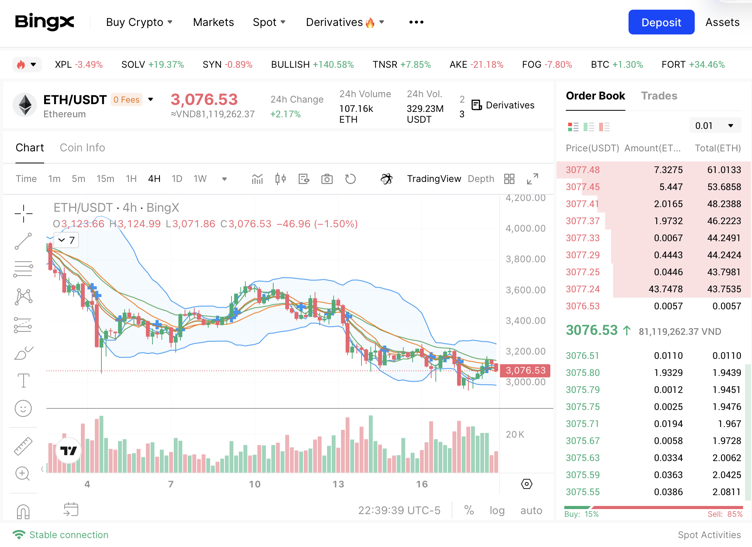
ETH price dynamics (Source: TradingView)
Reading momentum increases uncertainty. The Chande Momentum Oscillator is hovering around 32, indicating an improvement from recent oversold levels. However, as it remains below the midline, traders see a neutral-to-bearish situation until momentum builds further. Therefore, the market lacks certainty of change.
Futures and spot flows reflect defensive positioning
Open interest in Ethereum futures has declined from its September peak of over $40 billion. The current level is hovering around $35.8 billion. Traders reduced leverage after September’s rally. However, open interest still shows high participation and the derivatives market remains active. Furthermore, this pattern suggests that traders remain involved even as volatility increases.
Source: Coinglass
ETH spot flows tell a different story. Outflows are predominant across all major products, with deficits continuing from September to October. Additionally, Ethereum recorded an outflow of $61 million on November 25th. These trends highlight continued risk mitigation by large holders. Notably, the spike in inflows remains short and small, reinforcing the defensive tone.
Related: Solana Price Prediction: SOL Attempts to Rally as ETF Expansion Signals Market Interest
BitMine expands its accumulation as financial strategy expands
BitMine Immersion has revealed that its crypto and cash holdings have reached $11.2 billion. The company currently holds 3.63 million ETH, which is 3% of the total supply.
Additionally, BitMine has added approximately 70,000 ETH in the past week. This shows that accumulation continues even during market downturns. The company also manages $800 million in cash and a smaller allocation to other assets.
BitMine aims to achieve a 5% share of the ETH supply. Analysts see this as a key strategy for the long term, as it aligns with expectations of rising infrastructure demand.
Additionally, the company ranks as one of the most traded US stocks and is gaining recognition as a crypto-focused financial company. As a result, that strategy is now influencing broader debates about institutional accumulation within the Ethereum ecosystem.
Technical outlook for Ethereum price
Ethereum trades within a medium-term downtrend, so the key levels are still clear.
The first major hurdles on the upside lie at $2,886, $3,166, and $3,479. A break above these resistance levels could start a move towards $3,732 and even $3,985.
The downside level includes minor support at $2,750, followed by a cycle low at $2,659. If you lose $2,659, you will be subject to a $2,500 psychological retest.
The upper limit of resistance is near $2,900, with the 9-EMA currently capping any rebound attempts. Recovering this level is essential for medium-term bullish momentum.
The technical structure shows that ETH is sliding within a wide descending channel, with compression continuing to limit volatility. A decisive break outside this channel determines the next directional wave.
Will Ethereum recover?
Ethereum’s near-term prospects depend on whether buyers can defend $2,659 long enough to challenge the $2,886 to $2,900 zone. Momentum remains fragile, but improving indicators suggest selling pressure is easing.
Additionally, the $3,166 structural resistance serves as the first confirmation level for a trend reversal. A strong pullback could send ETH towards $3,479, with strong inflows pushing ETH towards $3,732.
Failure to protect $2,659 risks breaking the lower end of the cycle and exposing ETH to $2,500. Such a move would weaken the broader structure and reset sentiment. For now, ETH is in a decisive zone. The next leg depends on regaining momentum, spot flows, and whether buyers can convert short-term resistance into support.
Related: Monad (MON) Price Prediction 2025, 2026, 2027, 2028-2030
Disclaimer: The information contained in this article is for informational and educational purposes only. This article does not constitute financial advice or advice of any kind. Coin Edition is not responsible for any losses incurred as a result of the use of the content, products, or services mentioned. We encourage our readers to do their due diligence before taking any action related to our company.