


Ethereum has broken above a key technical level against Bitcoin, the 50-week exponential moving average (EMA) that marked the beginning of the previous bull market.
At the time of writing, the price of ETH is $3,530, with a 24-hour trading volume of approximately $38 billion. It is up 2% in the past day and 5% in the last week.
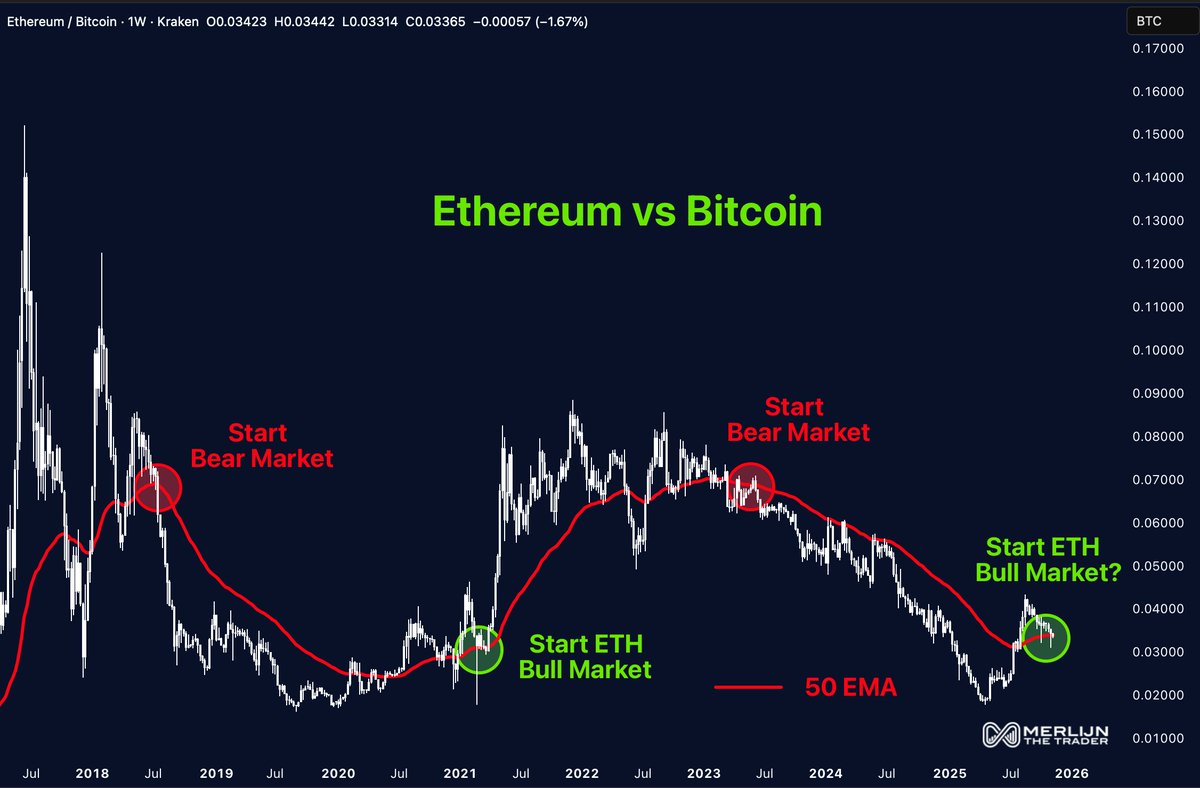
ETH/BTC remains above major weekly averages
After retaking the 50-week EMA, Ethereum’s strength against Bitcoin is in the spotlight. In past cycles, this signal signaled the early stages of an ETH bull market. The same pattern appeared in early 2021, before Ethereum rose to all-time highs.
Merlijn’s chart data shows this repeating setup. Historical breakdowns below the 50 EMA occurred in 2018 and 2022, followed by long periods of decline. ETH is now back above this line. “Here’s a retest of the bullishness…and the battle.“If this level is maintained, it could be the start of a new trend,” he said.
Additionally, Ethereum recently fell from near $4,960 to lows of just over $3,000. as crypto potato According to the report, this move is similar to the decline in ETH in 2020 before it started its massive rally.
Ethereum price builds foundation around major range
The technical analysis shared by Marzel points to a possible long setup forming between $3,336 and $3,400. Ethereum is currently trading within this range. This zone also coincides with the commonly tracked Fibonacci retracement level.
Targets on the chart include $5,982, $6,738, and $7,200. This setup assumes that ETH remains above the $3,000 level. This chart also shows a long-term breakout from the downtrend line that Ethereum appears to be retesting. If this trend holds, this trend could continue to rise until 2026.
You may also like:
- Major Ethereum holders show confidence and withdraw over $1.4 billion from Binance
- Binance ETH trading volume explodes above $6 trillion: what this means
- Robert Kiyosaki sets huge BTC, ETH price targets after warning of impending crash
Short-term breakout signal, upside potential
According to Joe Swanson’s analysis, a descending wedge pattern is also forming on the 4-hour chart. The breakout occurred around $3,560. ETH is currently trading just above that level. This pattern has a target near $4,415. Noting that the transition could occur by mid-December, Swanson said:
“Decisive action could trigger a 25% rise.”
The 200 EMA near $3,790 could be the next resistance level.
Meanwhile, around 413,000 ETH was withdrawn from Binance in one day, according to the data. This is the largest daily outflow since February. When coins move out of exchanges in large numbers, it is often associated with long-term holding behavior.