


- Ethereum’s price correction is poised for a major support test at the lower trendline of the flag pattern.
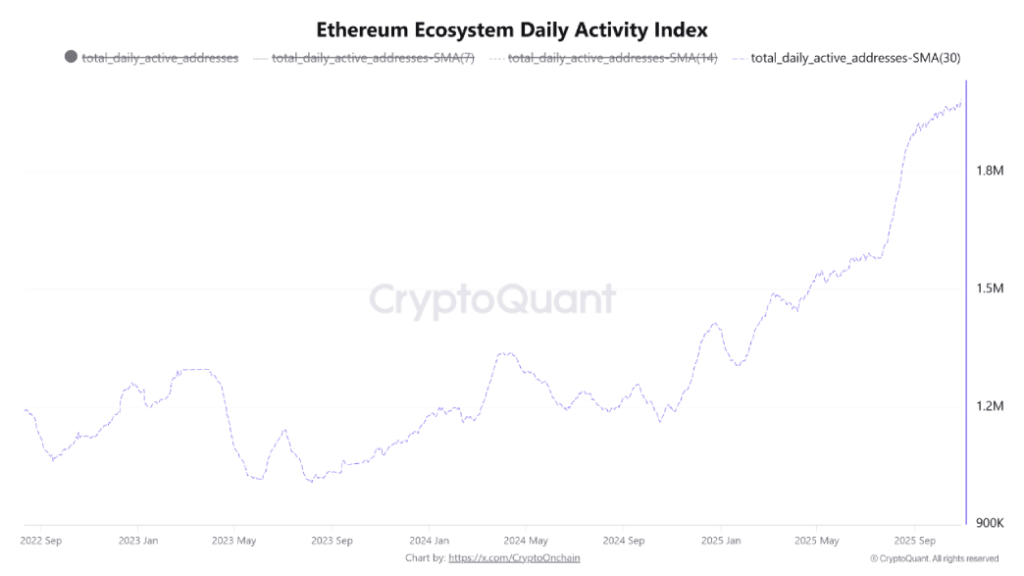
- The Ethereum Ecosystem Daily Activity Index surged to a new high of 1.985 million addresses today, highlighting true network health and growing user adoption.
- ETH fear and greed fell to 35%, highlighting the bearish sentiment among market participants.
ETH, the native cryptocurrency of the Ethereum ecosystem, plunged more than 2.6% on Thursday, trading at $3,800. The decline appears to have been due to a selling mood in the market after the US Federal Reserve (Fed) cut interest rates by 25 basis points (bp). Despite increasing selling pressure, Ethereum’s on-chain data points to solid fundamentals for its ecosystem, increasing the likelihood of a new recovery.
ETH activity reaches record high as network engagement surges to over 1.98 million addresses
Last Wednesday, the Fed cut interest rates by 25 basis points, lowering its target range to 3.75% to 4.00%. Although this move was aimed at boosting the job market and economic growth, the crypto market witnessed a sell-off.
As a result, Ethereum price has fallen over 2.59% today and is currently at $3,808. While price trends suggest a continued correction, CryptoQuant’s latest analysis highlights notable milestones in on-chain data.
As shown in the chart below, the Ethereum Ecosystem Daily Activity Index, which aggregates address activity from the 76 largest tokens created on the network, hit an all-time high of 1.985 million active addresses on a 30-day simple moving average basis.
This metric is a measure of sustained engagement across the Ethereum ecosystem, smoothing out short-term fluctuations to reflect medium-term engagement. Recent information appears to indicate a steady upward trend in participation within Ethereum’s decentralized ecosystem, rather than a temporary spike, indicating an increasing intensity of user participation.
Unlike trading indicators, which are prone to speculative behavior, this indicator focuses on wallet activity and shows how often users interact with applications in various areas of decentralized finance (DeFi), NFT marketplaces, and other blockchain platforms.
What is distinctive about the current trend is the distribution of growth rates. Rather than being concentrated in one or two major projects, activity has increased across dozens of tokens, indicating that attention and liquidity is being spread across the broader Ethereum-based altcoin market. This diversification of engagement tends to be followed by a period of increased turnover into smaller crypto assets.
This surge in participants on the network comes as the broader cryptocurrency market is attempting to stabilize after recent market volatility. Historical data shows that spikes in Ethereum ecosystem activity are often accompanied by early signs that the altcoin market is heating up. According to CryptoQuant analysts, the latest numbers represent one of the most widespread and sustained growths in Ethereum’s user base to date.
Ethereum price approaches major support test
Over the past four days, Ethereum price showed a sharp bearish reversal from $4,000 to $3,800, posting a 10.5% loss. The price decline on the back of an increase in candlestick length and an increase in trading volume emphasizes the sellers’ belief that a long-term decline will occur.
If the selling continues, Ethereum price could drop another 6.5% and test the lower trendline of the bullish flag pattern at the $3,500 mark. Since late August 2025, the coin price has consolidated within two flag channel downtrend lines, providing dynamic resistance and support for traders.
Interestingly, retesting the bottom trendline often restores bullish momentum in price, with a recovery in the 20% to 25% range. If the flag support holds, Ethereum price could witness a similar rebound and challenge the overhead resistance level around $4,400 again.
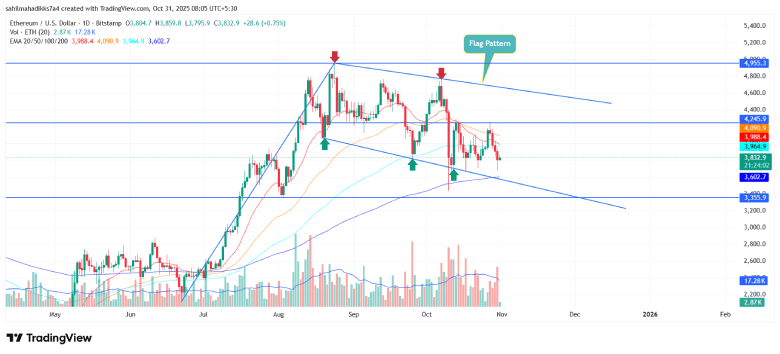
ETH/USDT -1 day chart
A bullish breakout of this resistance is very important to confirm the continuation of the uptrend.