Ethereum has failed to regain the key $4,200 resistance and is showing signs of weakness. Despite strong bullish momentum earlier this month, the price movement remains confined within a descending channel, and the recent rebound has been relatively weak. Traders are now focused on whether ETH can make another new low or whether there will be more downside.
technical analysis
Written by Shayan
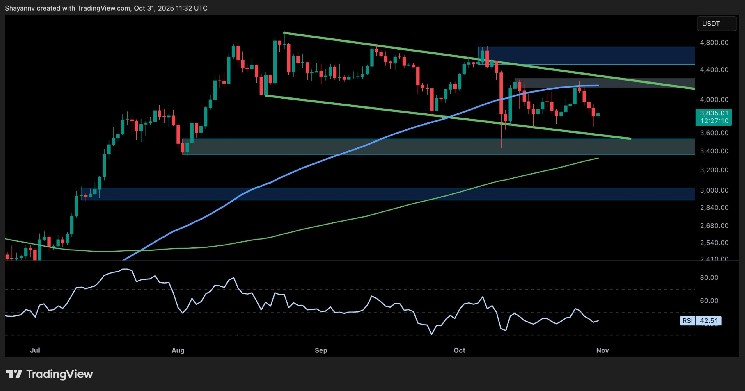
daily chart
Ethereum continues to respect the boundaries of the descending parallel channel and was rejected from the upper trendline multiple times. The recent attempt to break out around $4,200 failed and the price moved back into the midrange and tested the support near $3,700.
The asset has remained above its 200-day moving average, a key dynamic support level, for now, but has now cut back from its highs, a sign of weakening bullish momentum.
The RSI also dropped to around 42 on this day. This reflects buying pressure cooling off before we enter a fully oversold situation. If ETH loses the $3,700 support, the next major demand zone will be around $3,400, where the lower channel support and horizontal level intersect. However, if buyers are able to regain the $4,000 area, it is very likely that they will test the $4,200 level again.
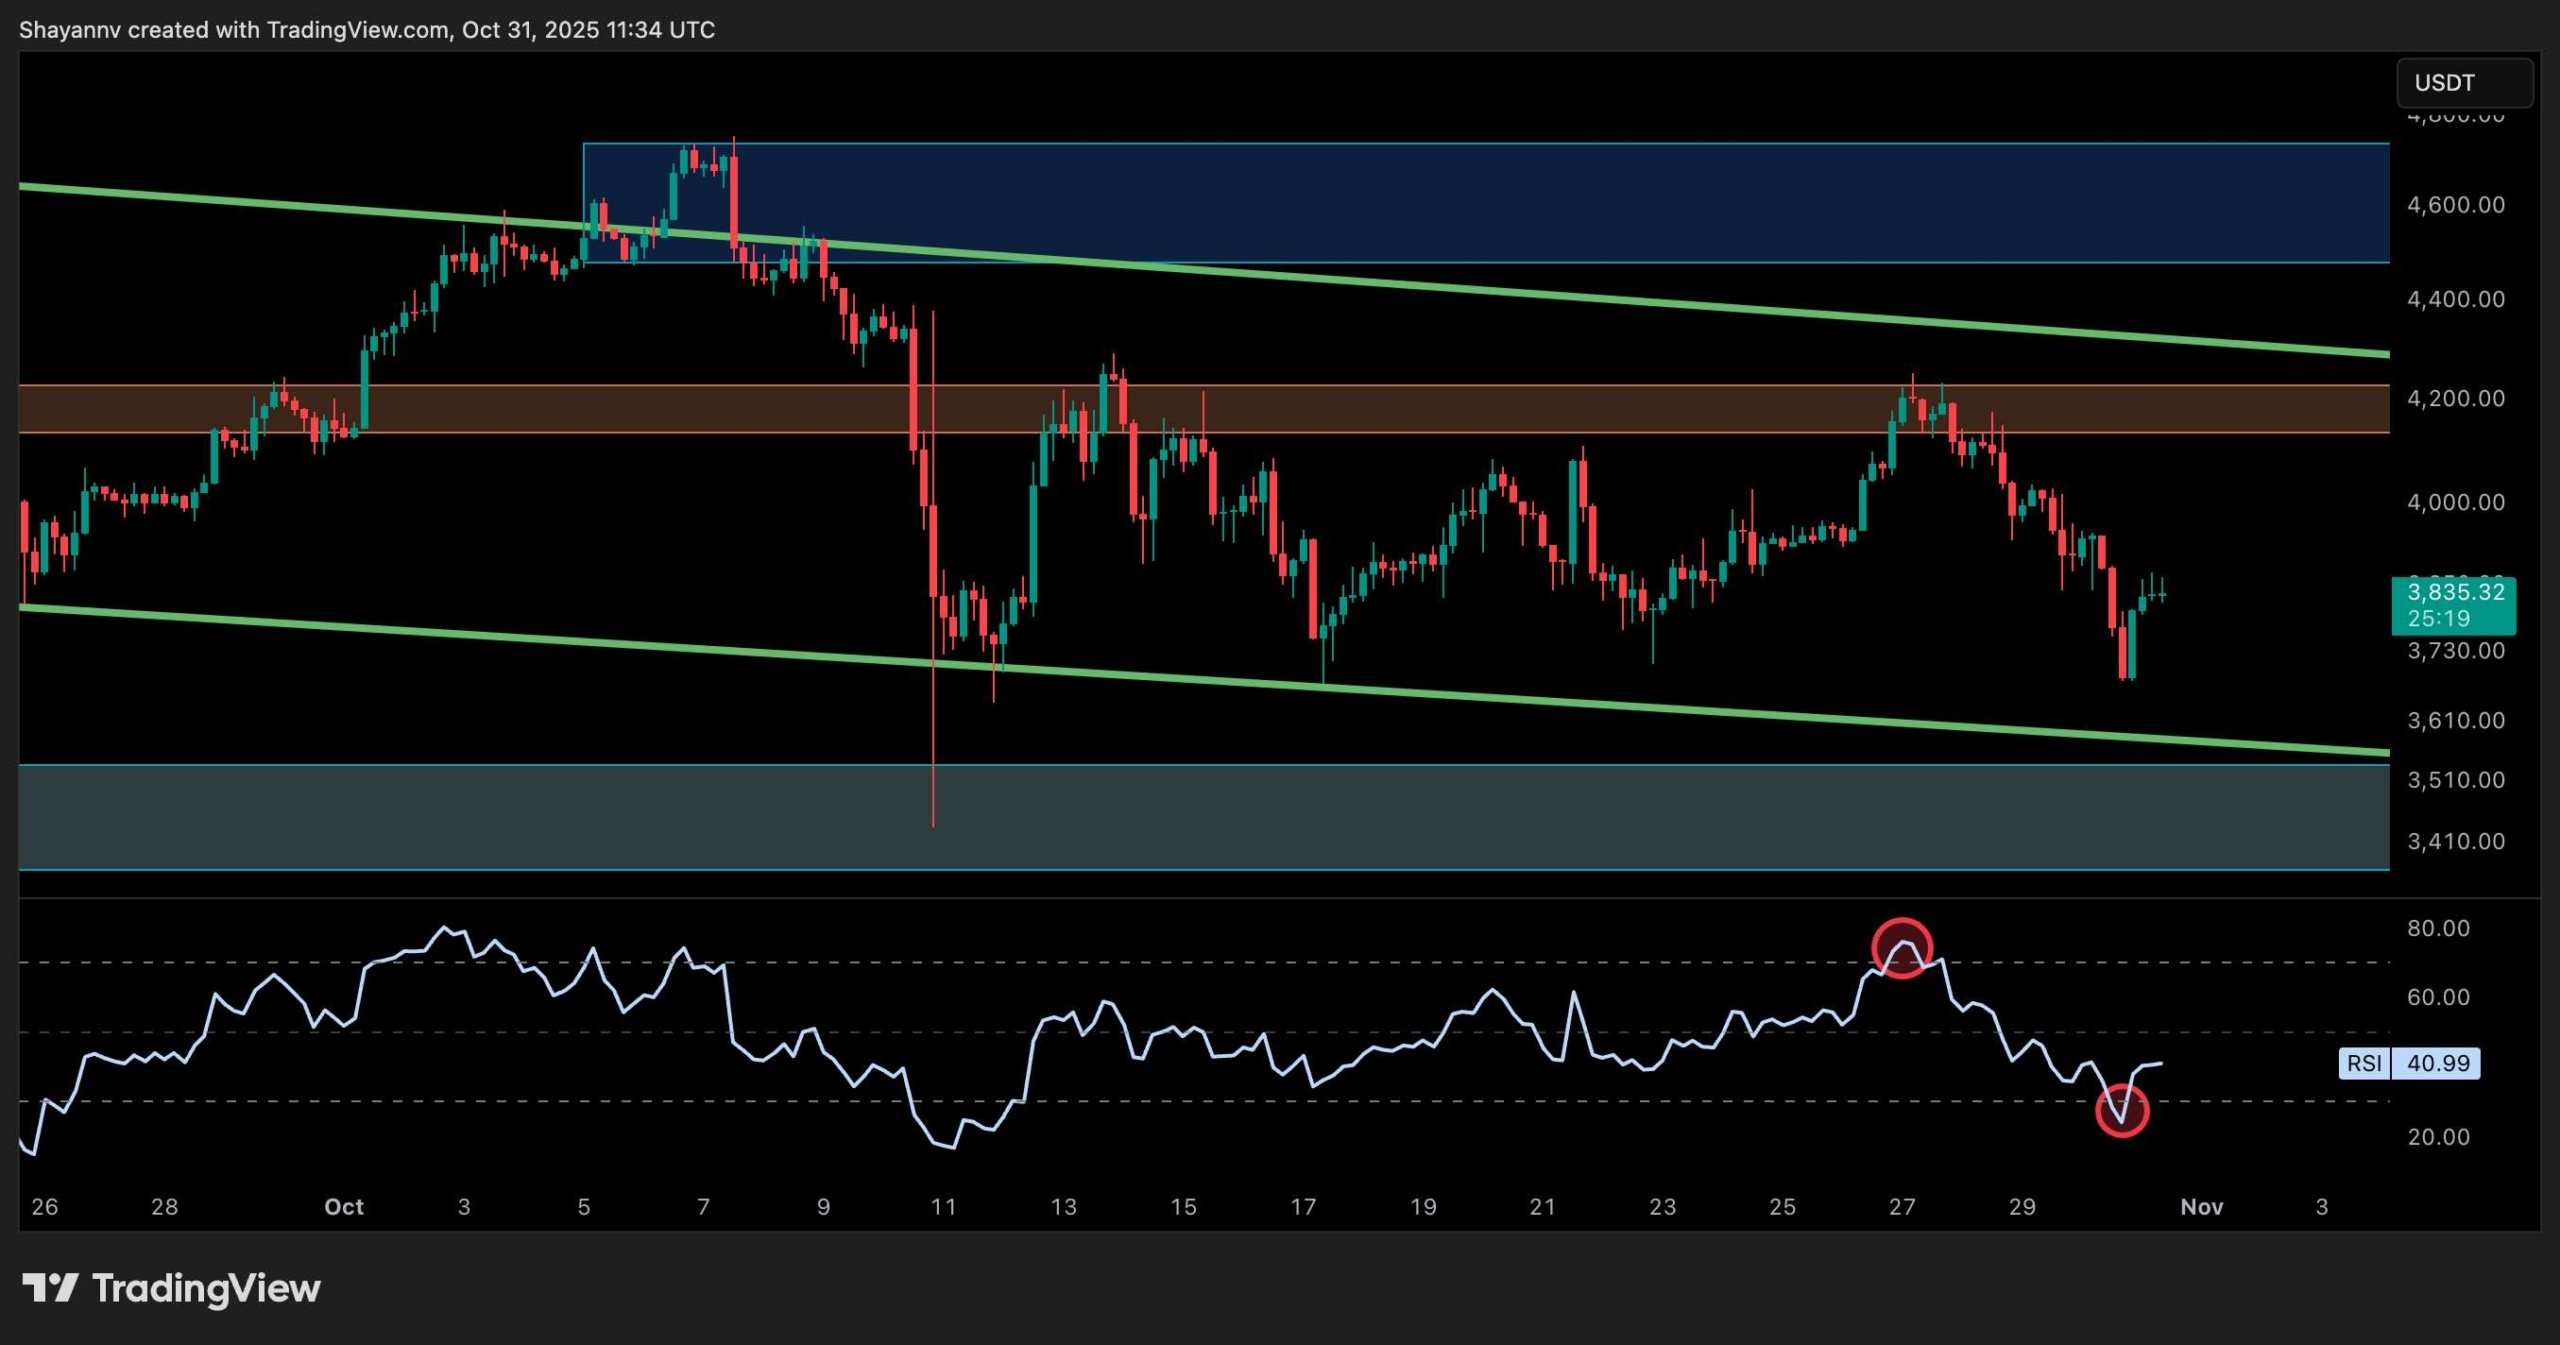
4 hour chart
On the 4-hour chart, the situation becomes more detailed. After the recent rejection from $4,200, ETH fell sharply to the lows of the range, but was cleared before a small rebound appeared. The price is currently hovering around $3,800 and is trying to regain momentum. The RSI has also reached oversold territory and is now on the rise, indicating a short-term relief rally or possible consolidation within the range.
Despite the small pullback, ETH is still below the key resistance zone at $4,000. This area is very important. This is because a clean break and close in this area will indicate interest from new buyers. Until then, short-term bulls may face selling pressure. If the current rally loses momentum, ETH could revisit the $3,650 low or even test the $3,400 demand zone in line with the bottom of a larger descending channel.
sentiment analysis
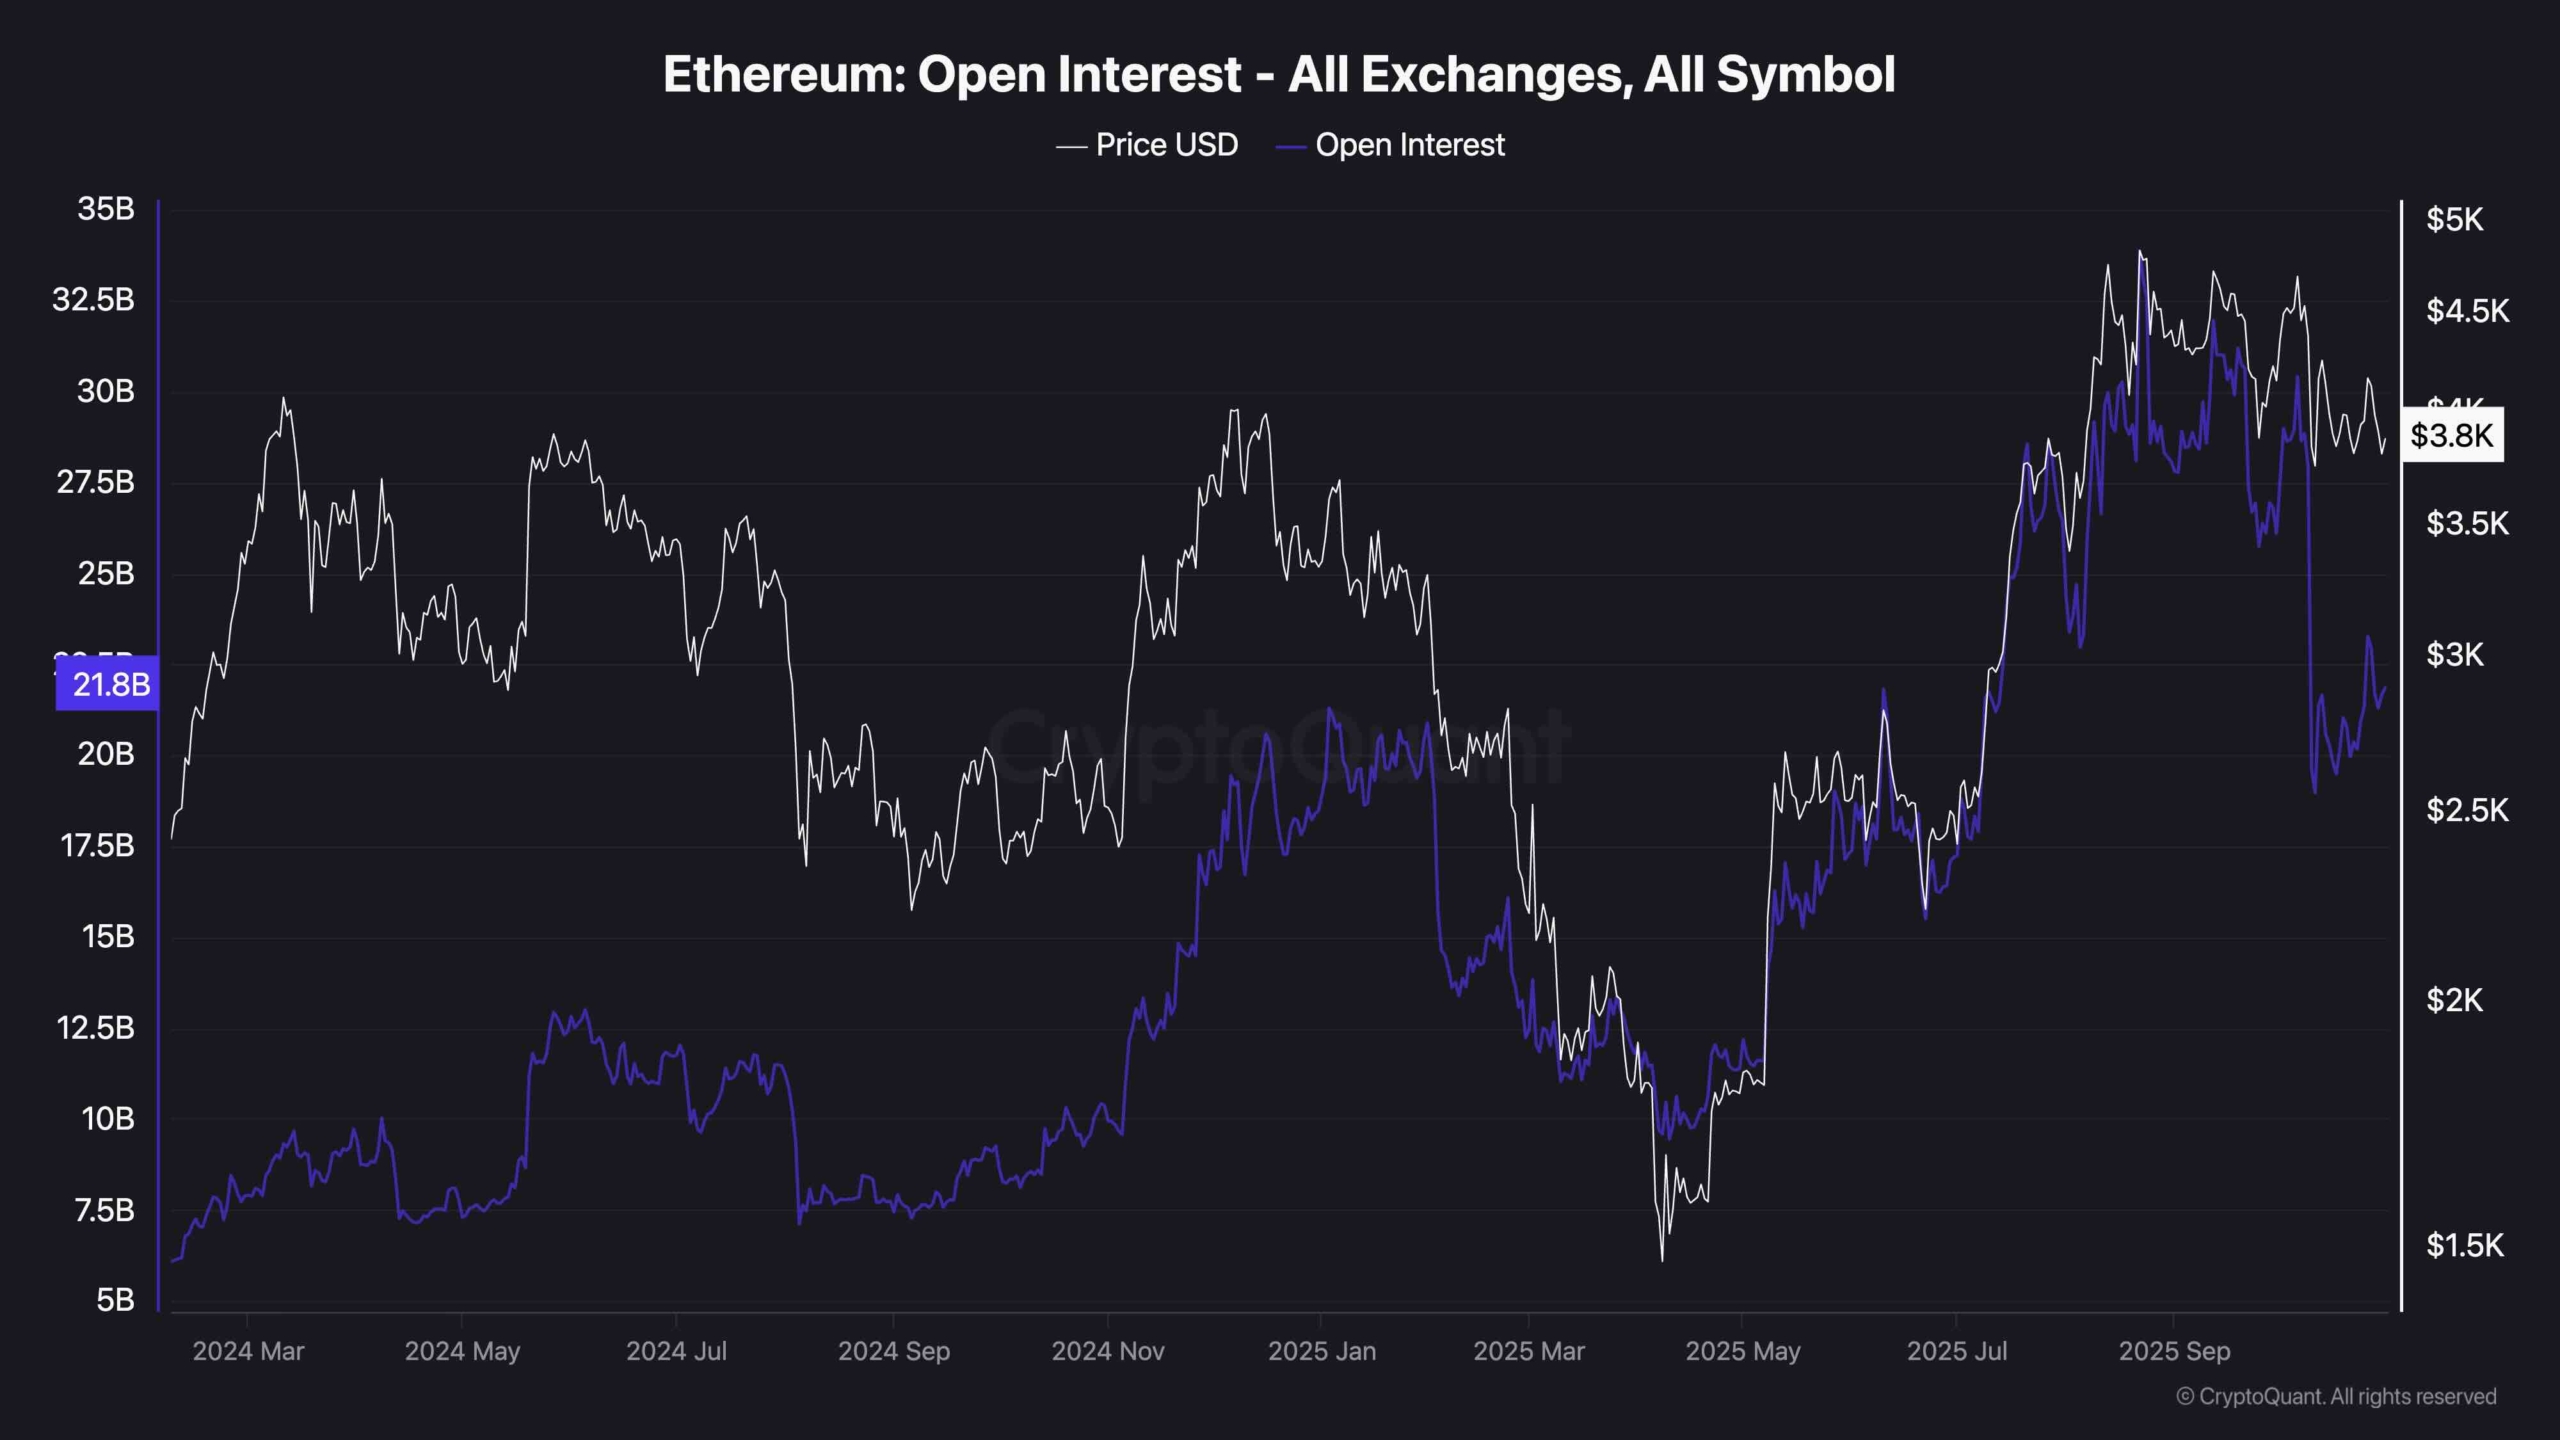
Open interest
Ethereum’s open interest has reset significantly, plummeting from over $32 billion to around $22.8 billion. This decline reflects widespread market-wide deleveraging, likely caused by a combination of traders’ stop-hunting, liquidation, and risk-off behavior. The rapid flush of open positions suggests that many overexposed longs were forced out, especially after ETH rejected the $4,200 resistance area.
Such a sudden drop in OI is often a necessary cleanup to reset the overheating condition. If leverage increases too aggressively, the market will tend to shake off weak hands before establishing a more stable trend. That seems to be what happened here. However, what is notable is the current stagnation, with open interest not recovering along with the price, indicating that traders are still hesitant to re-enter the scale.