Bitcoin price weekly outlook
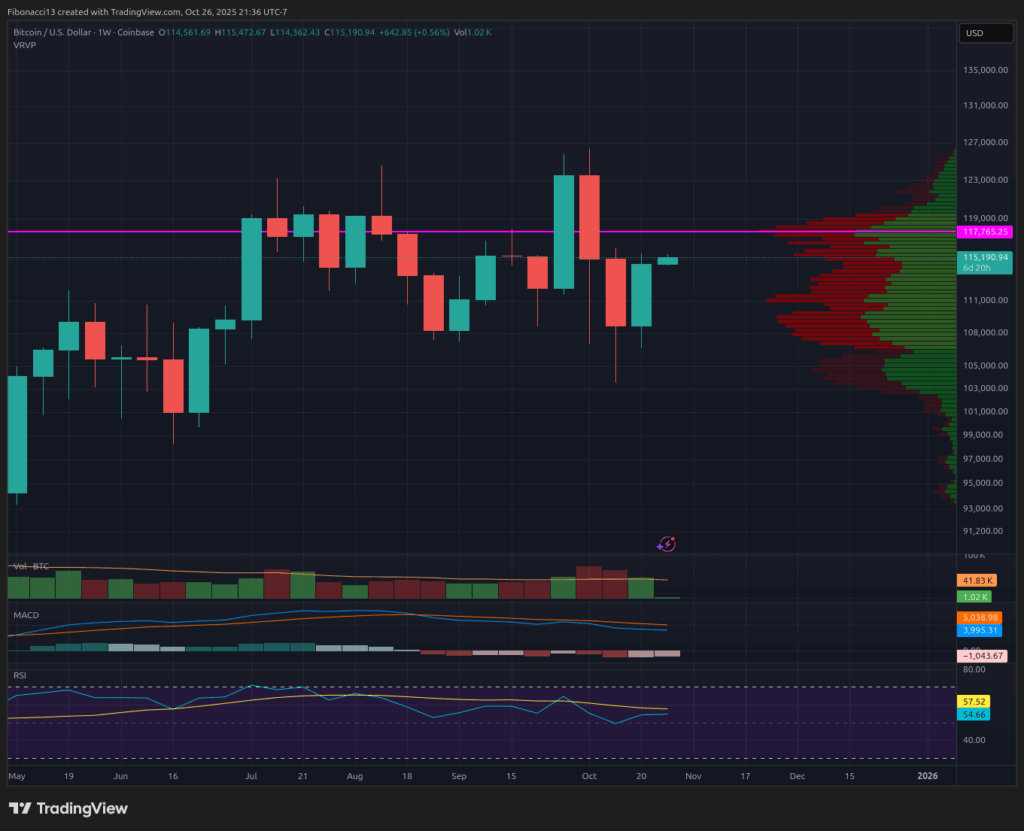
Bitcoin price action has been fairly subdued over the past week, with traders left speculating whether there will be another significant price drop heading into the weekend. However, the price rose above the low and slowly inched up to end the week at $114,530. Bulls should not get too disappointed with this price action as it has regained the resistance level at $112,200 and is now close to conquering the next resistance level at $115,500. However, the bears are still comfortably in control as there is a stronger resistance level hanging overhead that the bulls have not yet challenged. This could be an interesting and volatile week with the FOMC meeting on Wednesday and a number of large companies scheduled to report their third quarter results.

Current major support and resistance levels
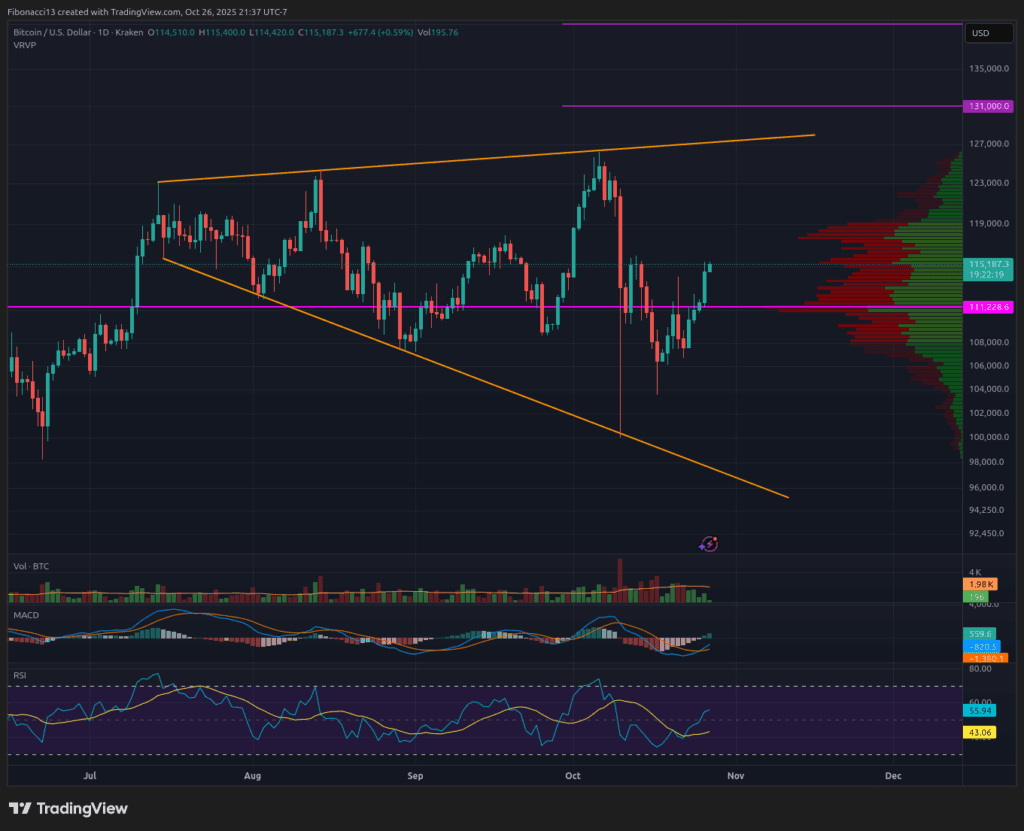
Nothing much has changed from last week’s resistance level as the bulls have made little progress. The bears are not feeling any real pressure yet as strong resistance still lies at $117,600 and above it at $122,000. If we happen to break above $122,000 this week, we will be looking at the upper bound of the expanding wedge pattern at $128,000.
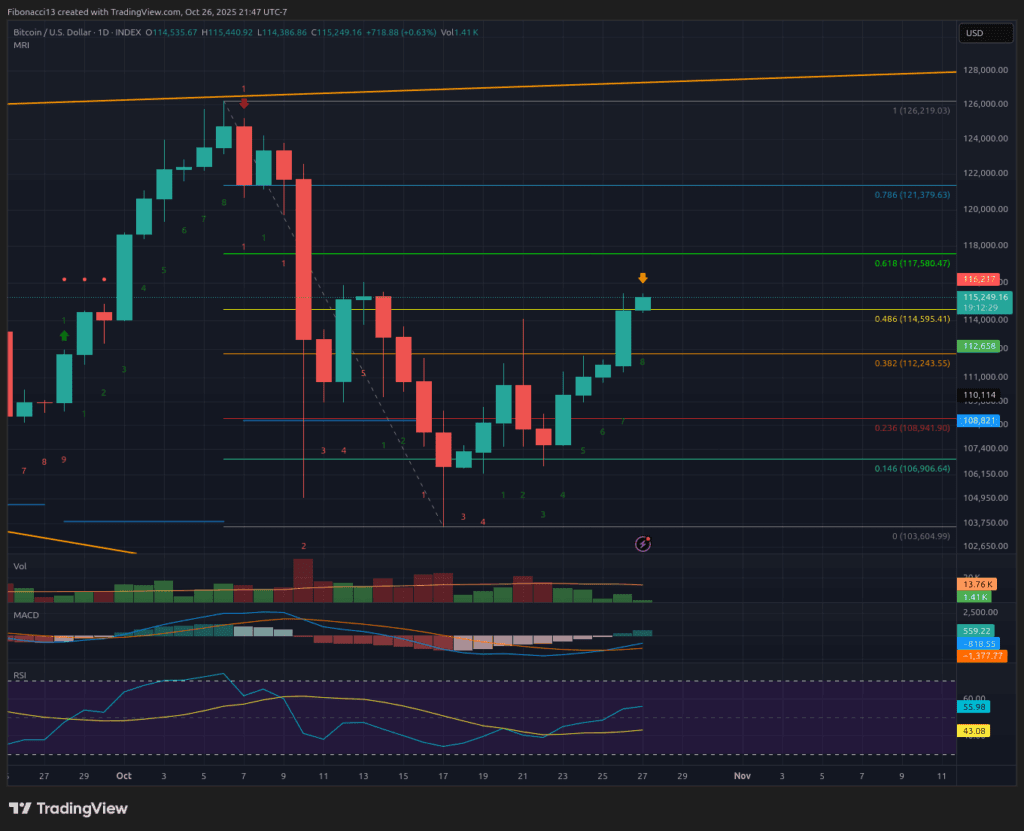
While the break above last week’s low is a positive sign for bulls, the price was able to sustain above the key short-term support at $106,900 last week as well. This level should hold going forward as a close below $106,900 opens the door to the $105,000 to $102,000 support zone, which has already been tested twice. The third test of this support zone is more likely to break the support zone than hold it. $96,000 is a long-term bull market support level below here, and a do-or-die support level if the price falls to test it.

This week’s outlook
Significant volatility is expected this week, especially on Wednesday, with the Fed’s interest rate decision followed by Powell’s speech, followed by major earnings reports from Microsoft, Meta, and Google after the market closes. The bulls are aiming to hold $109,000 as a floor through this week, which would help sustain the upward momentum. Looking at the momentum reversal indicator, we are currently sitting at an 8 count going into Monday. This is a warning candle that momentum may start to wane. The 9 count should arrive on Tuesday, at which point we should expect at least a break in the upward momentum and a 1-4 day correction in prices. Therefore, if the bulls can push the price to the 0.618 Fibonacci retracement of $117,600 by Monday night or Tuesday morning, we could expect a rejection there and reassess after Wednesday’s FOMC and earnings report developments.

Market atmosphere: Bears – The bulls gained some momentum last week, but the bears remain stoic and strong. The bulls need to push the price above $122,000 to regain control.
coming weeks
Even if the bulls manage to survive this week, there could still be headwinds. The US-China tariff dispute may or may not be resolved by the end of next week. Any negative outcome could cause all markets to fall. Additionally, a U.S. court ruling on the legality of President Trump’s tariffs is expected by November 5th. If these tariffs are reinstated, we should expect the market to factor in this impact and move lower.
Terminology guide:
Bulls/Bulls: Buyers and investors who expect prices to rise.
Bearish/bearish: Sellers and investors who expect prices to fall.
Support or support level: The level at which the price of the asset should be maintained, at least initially. The more you touch the support, the more likely it will weaken and the price will not be able to sustain itself.
Resistance or resistance level: Opposite of support. A level where the price is likely to be rejected, at least initially. The more times you touch the resistor, the weaker it becomes and the more likely it is that you won’t be able to keep the price down.
Fibonacci retracements and extensions: The ratio is based on what is known as the golden mean, a universal ratio that relates to cycles of growth and decline in nature. The golden ratio is based on the constants Phi (1.618) and Phi (0.618).
Widening wedge: A chart pattern consisting of an upper trendline that acts as resistance and a lower trendline that acts as support. These trend lines must move away from each other to validate the pattern. This pattern is the result of widening price fluctuations, typically with higher highs and lower lows.
Momentum Reversal Index (MRI): A unique indicator created by Tone Vays. The MRI indicator tracks the momentum and exhaustion of buyers and sellers, providing signals of when momentum weakens and accelerates.


