


Ethereum price remains above its fair value zone and maintains a strong long-term structure while settling from previous highs.
summary
- Ethereum remains above $3,900 despite slowing volume.
- On-chain data indicates a healthy integration phase.
- Currency inflows suggest modest short-term selling pressure.
At the time of writing, Ethereum was trading at $3,976, up 2.3% in the past 24 hours. Over the past week, the asset has fluctuated between $3,709 and $4,080, up 4%, but remains down about 5% over the past month. ETH is currently 19% below its all-time high of $4,956, set on August 24th.
Ethereum (ETH) 24-hour trading volume was $33.68 billion, a decrease of 15.4%. This suggests that activity has slowed down after a recent rapid movement.
Derivative trading volume fell 13.27% to $84.02 billion, while open interest rose 5.32% to $46.2 billion, according to Coinglass data. This combination often indicates that short-term trading has cooled while traders continue to hold open positions with reasonable confidence.
Ethereum price remains strong above fair value
According to an October 23 analysis by CryptoQuant on-chain analyst TeddyVision, Ethereum remains “above fair value, but has cooled from the upside.” Fair value is often expressed as the realized price, which is the average cost of all ETH in circulation when it was last moved on-chain, and essentially reflects what most holders paid for the coin.
ETH continues to trade above its realized price of around $2,300, which has historically marked the lower bound in fear-driven market phases. Being above this level indicates a healthy and resilient market structure.
You may also like: Ethereum Price Prediction: Can ETH regain $4,500 as network activity recovers?
With an MVRV ratio of 1.67, holders have earned an average return of 67%. This means the market is profitable but not overheated, confident but not euphoric. Price action also retreated before reaching the upper end of the realized price range around $5,300, indicating a natural consolidation after the recent rally rather than a trend reversal.
TeddyVision added that holders appear content to maintain profits as new spot inflows slow. The next rally will likely require fresh liquidity rather than leverage-driven buying.
Currency flows suggest short-term caution
Another CryptoQuant analyst, CryptoOnchain, highlighted the change in net flows on Ethereum exchanges from outflows to inflows, suggesting short-term caution.
Overall exchange netflow changed from approximately -57,000 ETH to +7,000 ETH in the last week, with Binance accounting for almost half of this change. The exchange’s 7-day net flow increased from -31,000 ETH to +3,000 ETH, suggesting that some holders are moving their ETH to the exchange and possibly selling it.
While this pattern is not alarming, it could indicate potential selling pressure, especially if it persists in conjunction with a slowing spot market.
Ethereum price technical analysis
Ethereum technical indicators reflect a neutral position. While the Relative Strength Index of 46.2 indicates balanced momentum, other oscillators such as Stochastics, Commodity Channel Index, and Average Directionality Index also indicate the absence of strong directional bias.
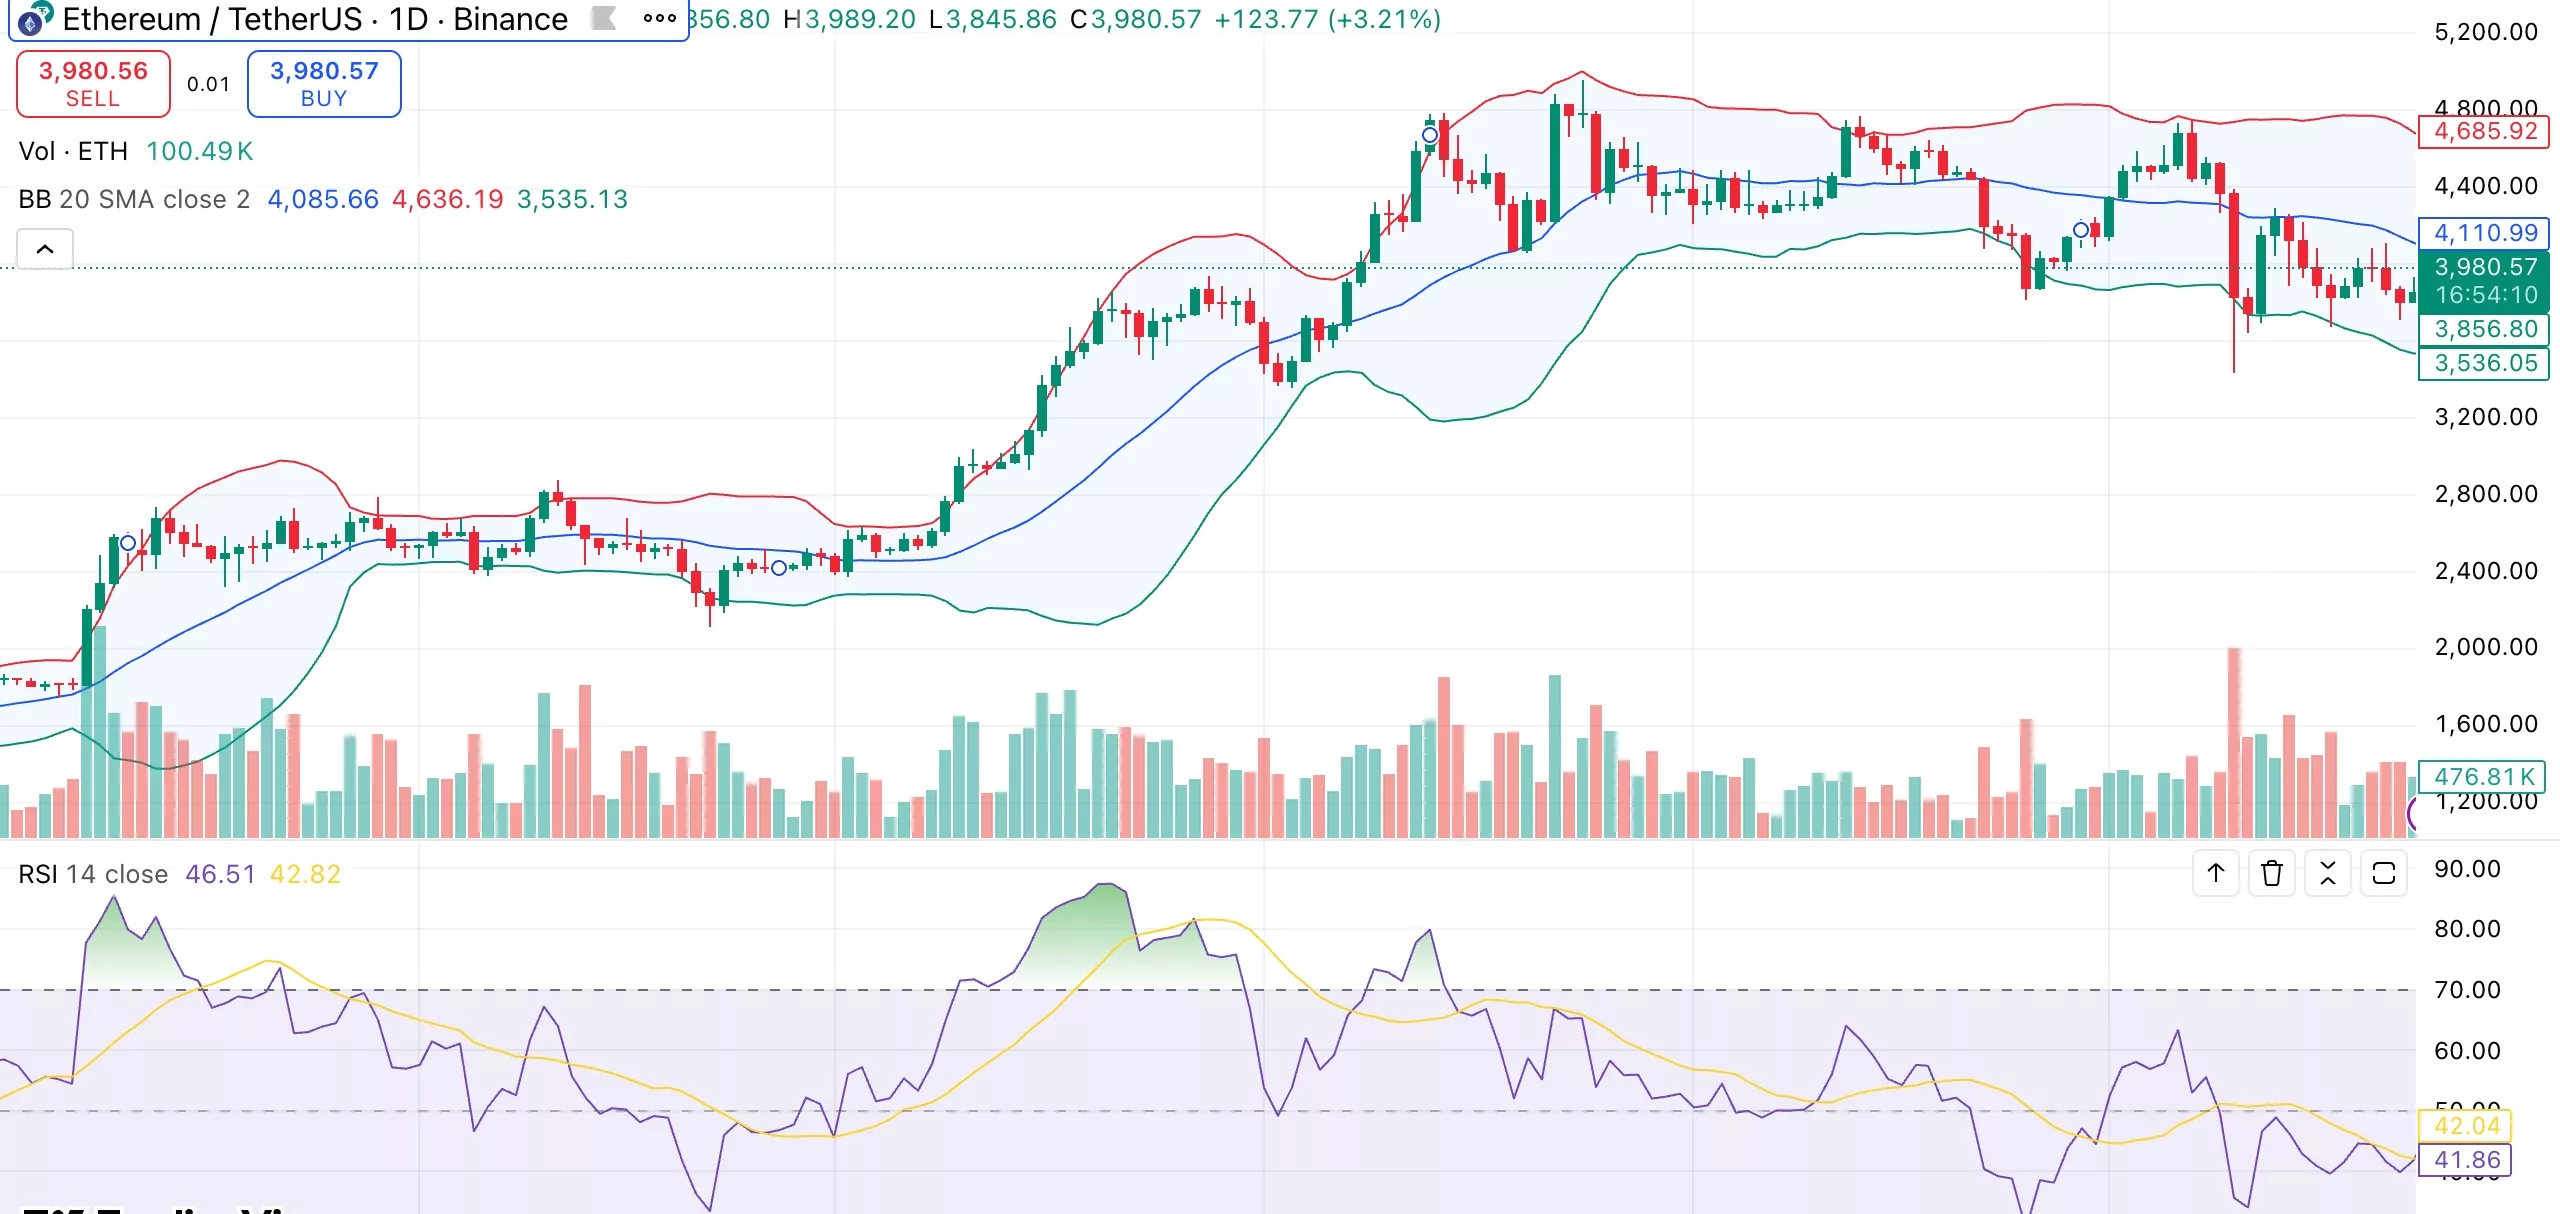
Ethereum daily chart. Credit: crypto.news
The short-term moving averages (10-day EMA and SMA) are in buy territory around $3,900, indicating resilience, but the 20-50-day averages remain bearish and point to broader consolidation. However, the 200-day EMA is still well below the current price of $3,577, confirming that the long-term uptrend is intact.
If ETH maintains its position above $3,900 and breaks above $4,100, the next target could be between $4,500 and $4,800. If selling pressure increases, a drop below $3,700 could pave the way for $3,400 and even $3,000.
read more: Ethereum’s Fusaka upgrade introduces transaction gas limit cap with EIP-7825