


Ethereum is showing strong technical signals that could point to a big rally. Multiple analysts are tracking the major patterns, support levels, and price zones that have historically preceded large rallies.
ETH is currently above an important level, and the focus has shifted to whether the momentum continues through the end of the year.
Monthly breakout points for higher goals
Cryptocurrency trader Marline the Trader posted a monthly chart showing that Ethereum is breaking out of its long-term pennant. The pennant was formed after ETH rose to a 2021 high near $4,800 and continued to move sideways within a range contraction for years. A breakout above this pattern signals new bullish momentum.
Analysts call it “The most explosive setup since 2017”, which could be headed for $8,000-$8,500. The asset has already broken above the pennant resistance and the current momentum appears to be in line with previous market cycles. At the time of writing, Ethereum is trading at around $4,100, marking a 4% increase in the past 24 hours.
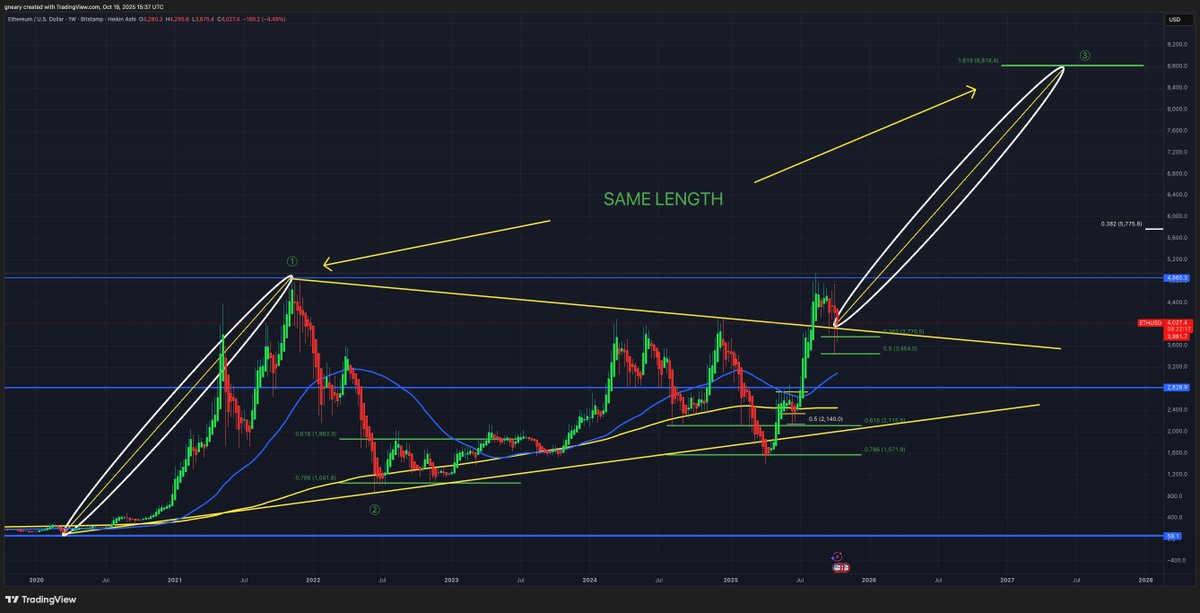
Additionally, another chart from EtherNasyonaL compares Ethereum’s current movement with past cycles. In both 2016 and 2020, ETH retested key demand areas before rallying. It looks like the same phenomenon will happen again in 2025. They say:
I’m not that bullish on $ETH.
In the first and second cycles, Ethereum tested major demand zones before going parabolic.
Now, the same scene is being reenacted.
The difference is that most people still leave the theater before the curtain rises. pic.twitter.com/0l92xFNtht
— EᴛʜᴇʀNᴀꜱʏᴏɴᴀL 💹🧲 (@EtherNasyonaL) October 19, 2025
Notably, the demand zone has held and prices have rebounded from that area. This pattern is consistent with ETH’s movement during the early bull market.
You may also like:
- Ethereum regains $4,000 and is poised for explosive breakout, analyst says
- Calm in Ethereum prices masks quiet accumulation – major companies are in no hurry to sell
- Almost all ETH held by companies was purchased in the past quarter alone
Currently supports retesting after breakout hold
According to Long Investor, Ethereum recently broke out of a multi-year wedge and is now retesting the top of the wedge as new support. For the past three weeks, ETH has been trading in the $3,700 to $3,900 range and has remained just above that line.
The trader believes ETH will need to break above this level within 10 days to confirm a breakout. If support holds, this move could mirror Ethereum’s rally in 2020, which underwent similar breakouts and support tests. The chart suggests a price target of around $8,200 if this structure holds.
Momentum mixes as MVRV declines
Analyst Daan Crypto Trades shared that ETH is testing both the 0.382 Fibonacci level and the daily 200 EMA. He pointed out:
“We would like to see this rise above the previous cycle high of $4.1,000 to regain momentum in the bulls’ favor.”
Holding this area could give the price the boost it needs to continue moving higher.
However, Ali Martinez took a different view and pointed out warning signals from the MVRV momentum indicator. The 160-day MVRV line is below the moving average, and this move occurred before ETH fell from $3,300 to $1,400. The same pattern has just returned, raising concerns about a possible short-term pullback.