


Bitcoin price corrected its gains and traded below the $124,000 level. BTC is currently struggling and may continue to remain below $120,000.
- Bitcoin started a downward correction below the $123,200 level.
- The price is trading below $123,000 and the 100 hourly simple moving average.
- The hourly chart of the BTC/USD pair (data feed from Kraken) shows a bearish trendline forming with resistance at $122,750.
- The pair could continue to fall if it trades below the $120,000 zone.
Bitcoin price falls further
Bitcoin price failed to break above the $125,000 zone and a new decline began. BTC fell below the $124,000 support and entered a short-term bearish zone.
The bears pushed the price below $121,200. The low was formed at $119,810 and the price has recently recovered some losses. There was a move towards the 50% Fib retracement level of the recent decline from the swing high of $123,750 to the low of $119,810.
However, the bears are still active near $121,750. Bitcoin is currently trading below $121,500 and its 100-hour simple moving average. Additionally, a bearish trend line has formed on the hourly chart of the BTC/USD pair with resistance at $122,750.
Immediate upside resistance is near the $121,750 level. The first major resistance is near the $122,250 level and the 61.8% Fib retracement level of the recent decline from the swing high of $123,750 to the low of $119,810.
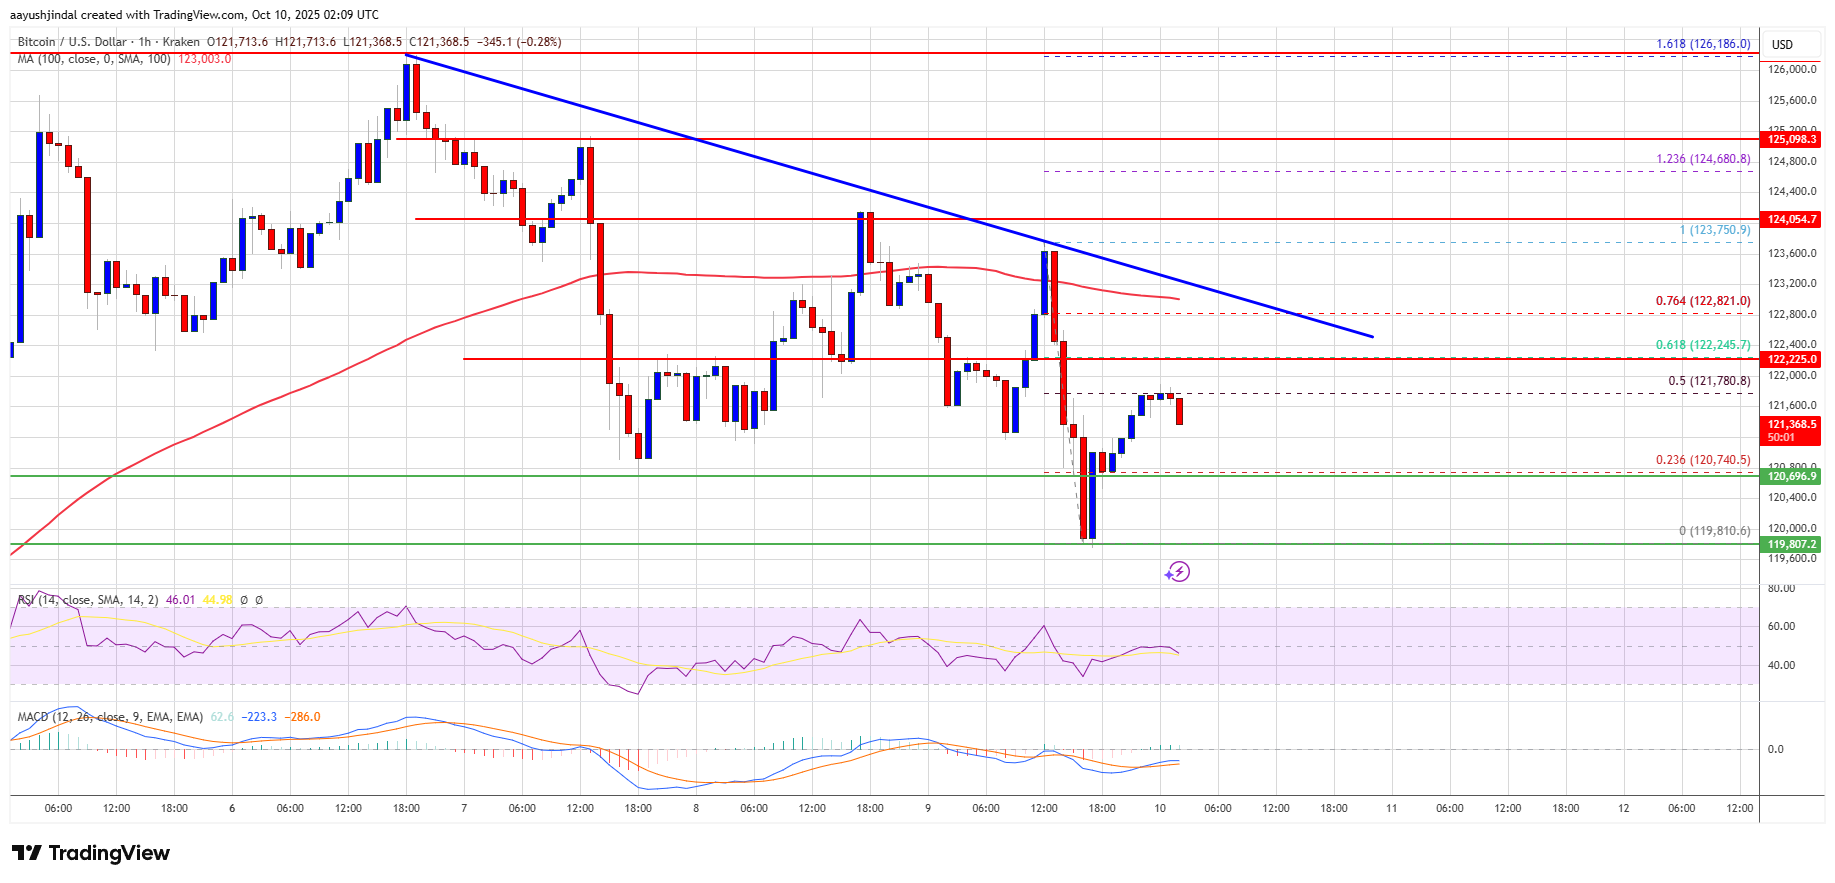
The next resistance level could be $122,750 and the trendline. If the price closes above the $122,750 resistance, the price could move higher. In the above case, the price could rise and test the $123,500 resistance. Further upside could push the price closer to the $124,000 level. The next barrier for the bulls could be $125,500.
Further losses for BTC?
If Bitcoin fails to rise above the $122,750 resistance zone, a new decline could begin. Immediate support is near the $120,750 level. The first major support is around the $120,000 level.
The next support is currently near the $118,500 zone. Any further losses could send the price towards the $116,500 support in the short term. The main support lies at $115,500, below which BTC may struggle to recover in the short term.
Technical indicators:
Hourly MACD – The MACD is currently pacing in the bearish zone.
Hourly RSI (Relative Strength Index) – BTC/USD’s RSI is currently below the 50 level.
Major support levels – $120,750, followed by $120,000.
Key resistance levels – $122,750 and $123,500.