


Something interesting is happening on the Ethereum charts. Ethereum price appears to be stuck around $4,700 after weeks of steady gains, but this is not a sign of weakness. Rather, the data and pattern suggest that ETH may just need a small decline before it rises again.
A drop to $4,410, a decline of around 6%, could complete a classic reversal setup that is often seen before a big rally. But first, on-chain data shows why traders should be cautious in the short term.
Currency flows ease as whales remain cautious
Changes in Ethereum exchange net positions, which measure the number of coins entering and exiting centralized exchanges, indicate a slowdown in purchasing activity. When this number becomes large and negative, it means more coins are being withdrawn and held by investors. As the negatives become less, traders will usually send more coins to the exchange in order to make a profit.
As of October 6th, ETH’s net position change is -1.5 million, up from -2.3 million on September 22, with 35% shifting to selling pressure. A smaller negative value means fewer withdrawals and slightly more deposits, indicating that some traders may be interested in taking profits after the recent rally.
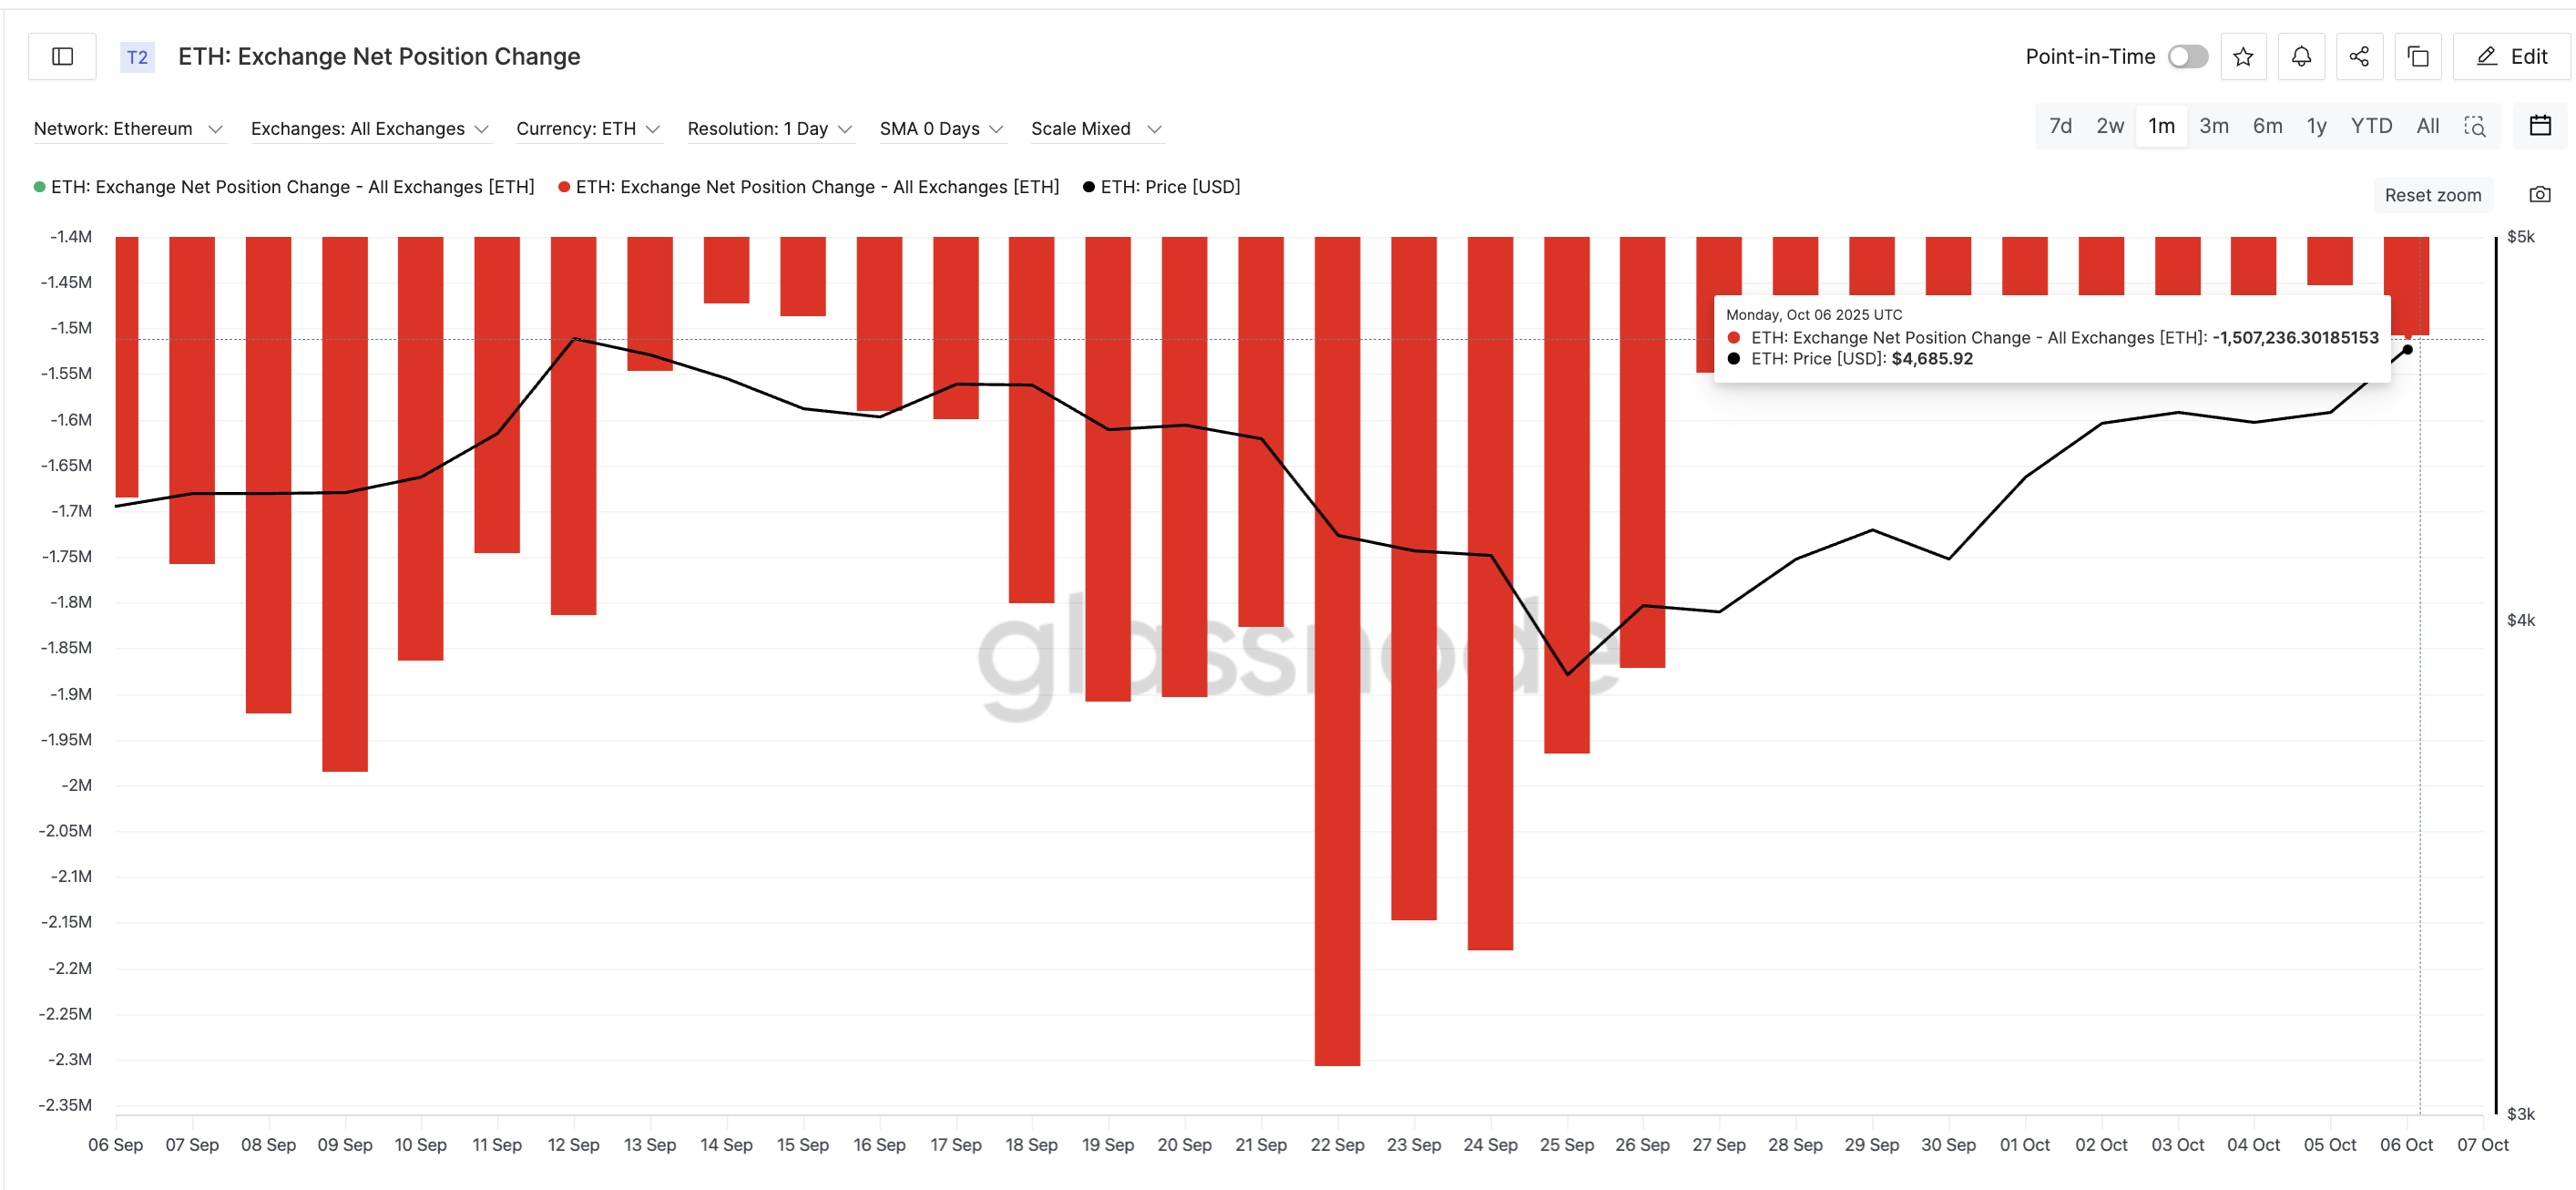
Ethereum seller gains ground: Glassnode
Want more token insights like this??Sign up for Editor Harsh Notariya’s Daily Crypto Newsletter here.
However, whale wallets holding large amounts of ETH remain confident. Over the past two days, their combined holdings have increased from 99.16 million ETH to 99.26 million ETH (approximately $470 million), according to Santiment data.
This is a slow but steady sign of confidence, even though some traders are probably recording gains on the retail side.
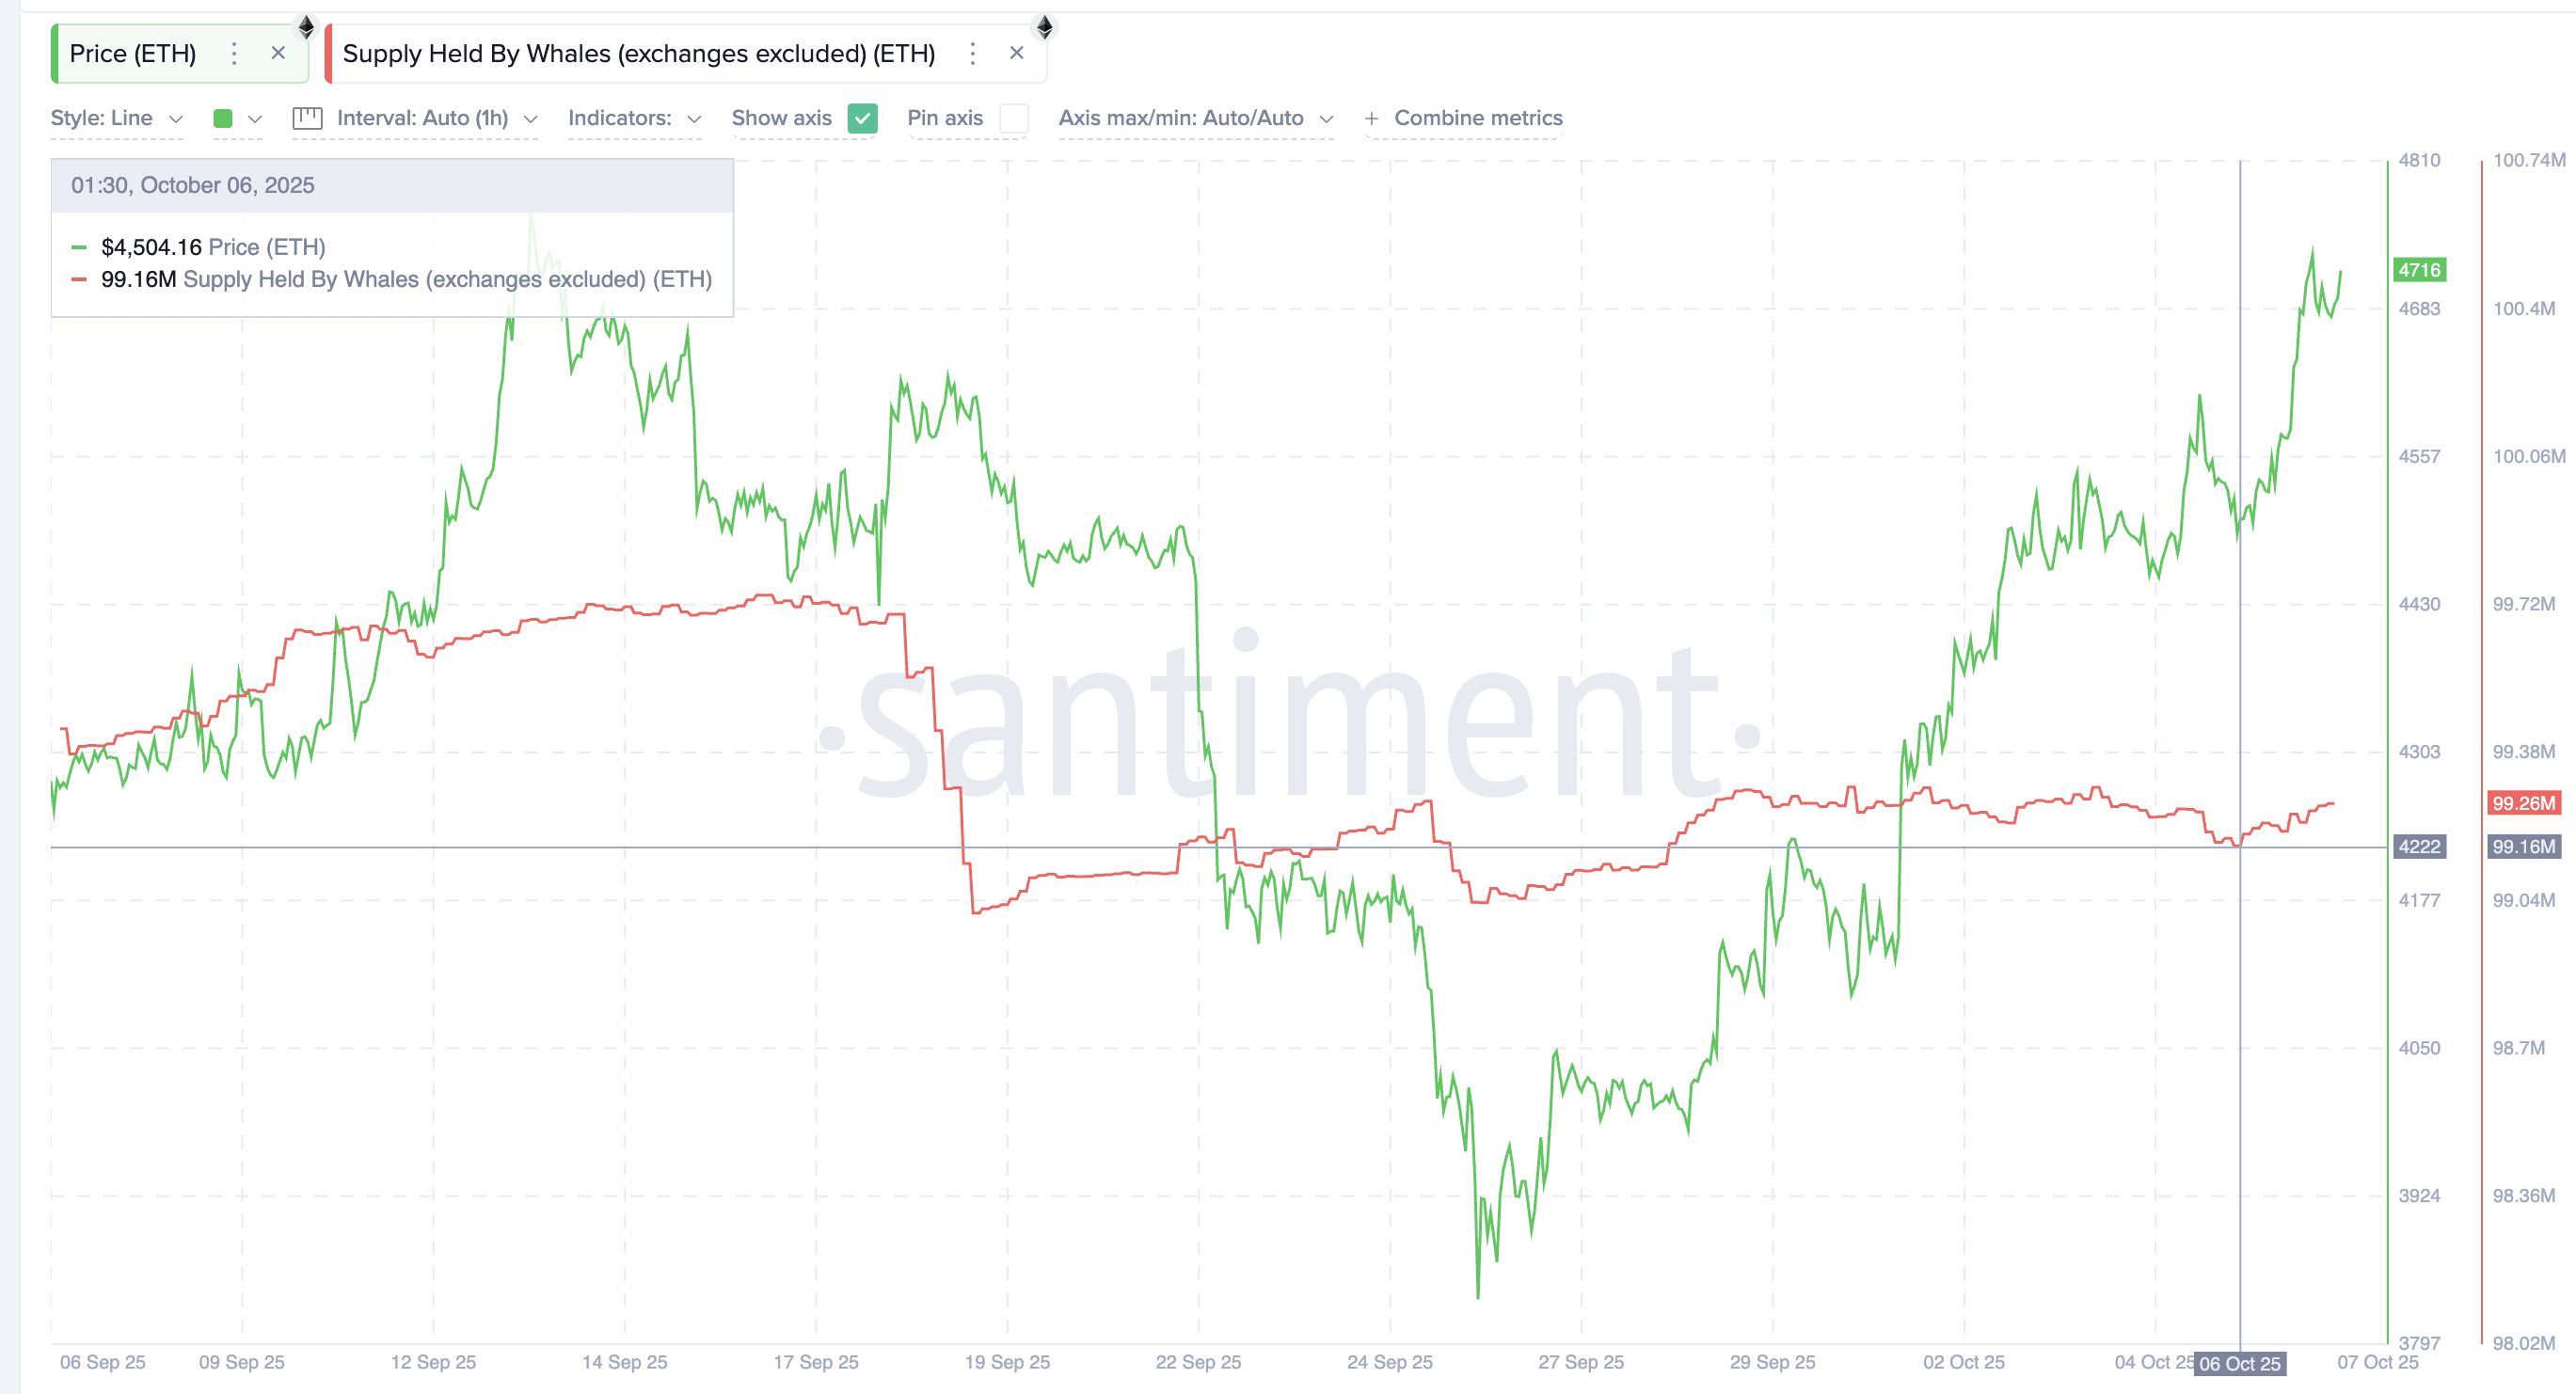
Ethereum whales continue to buy: Santiment
This combination of light retail selling and cautious whale buying usually indicates the market is waiting for a better entry, and often comes right before a short-term price correction.
Ethereum price chart signals temporary decline ahead of next rally
On the daily chart, Ethereum is trading within an inverted head-and-shoulders pattern, and this structure often forms before a bullish breakout. The “head” sits low and the neckline is aligned around $4,740.
For this pattern to complete, Ethereum may need to fall towards $4,410 to form a right shoulder, which would represent a 6% decline from current levels. The Relative Strength Index (RSI), which tracks buying momentum, supports this setup. From September 12th to October 7th, the RSI made new highs and the price made new lower highs. This often shows a hidden bearish divergence prior to a correction.
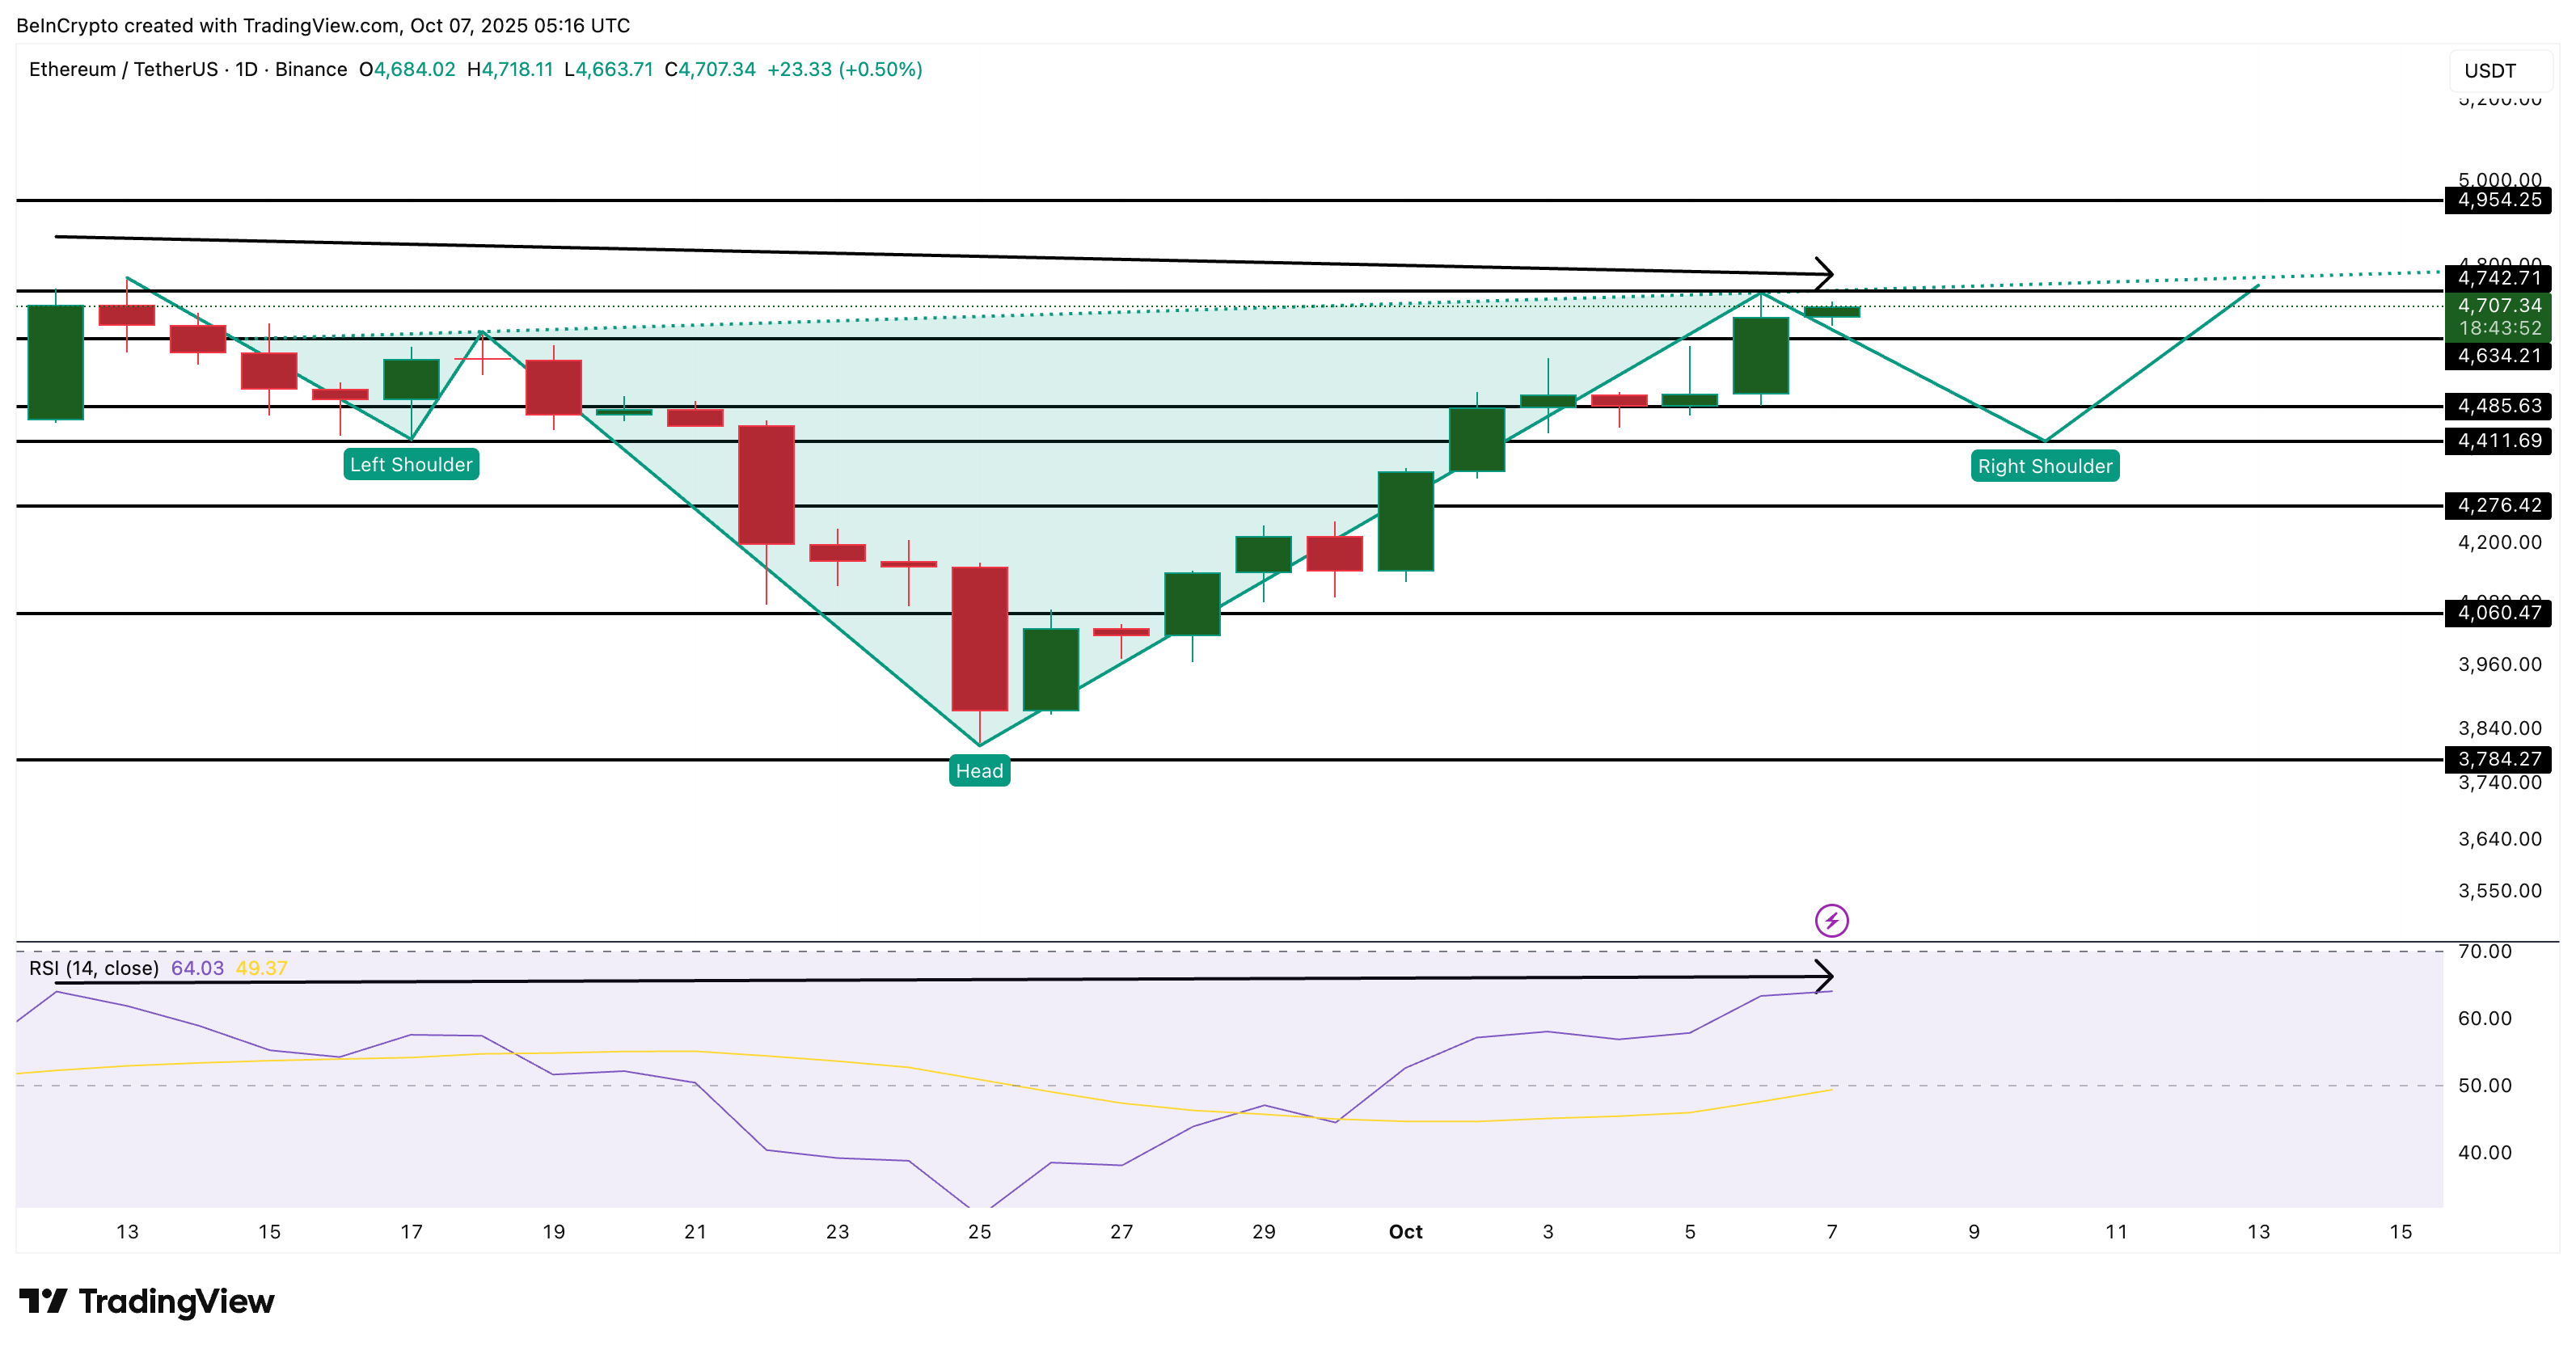
Ethereum Price Analysis: TradingView
If a pullback occurs, a rebound near $4,410 could lead to a breakout for Ethereum above $4,740. A confirmed daily candle above this level would open the door to $4,950 (near the previous high) and possibly new highs above.
Conversely, if Ethereum skips the correction and closes above the current $4,740 level, the immediate decline theory would be invalidated and continued strength would be confirmed. However, a more bearish scenario will only play out if Ethereum price falls below $4,270, delaying the bullish pattern and prolonging the consolidation.
Either way, Ethereum’s broad uptrend remains intact. This pause could be a lull before another strong rally.
The post Ethereum (ETH) Price Could Fall 6% Before Rising to New Highs — Here’s Why appeared first on BeInCrypto.