


Today’s Bitcoin prices are trading around $102,950 after tagging an intraday high of nearly $103,281 on May 9th. This sharp rally comes after BTC escaped from multi-day flag formation and surged beyond the important $100,000 psychological level. The bullish impulse is supported by breakouts from falling wedges that appear on the 4-hour and daily charts, pushing price action to test key resistance zones close to $103,700-104,000.
What will happen to Bitcoin prices?
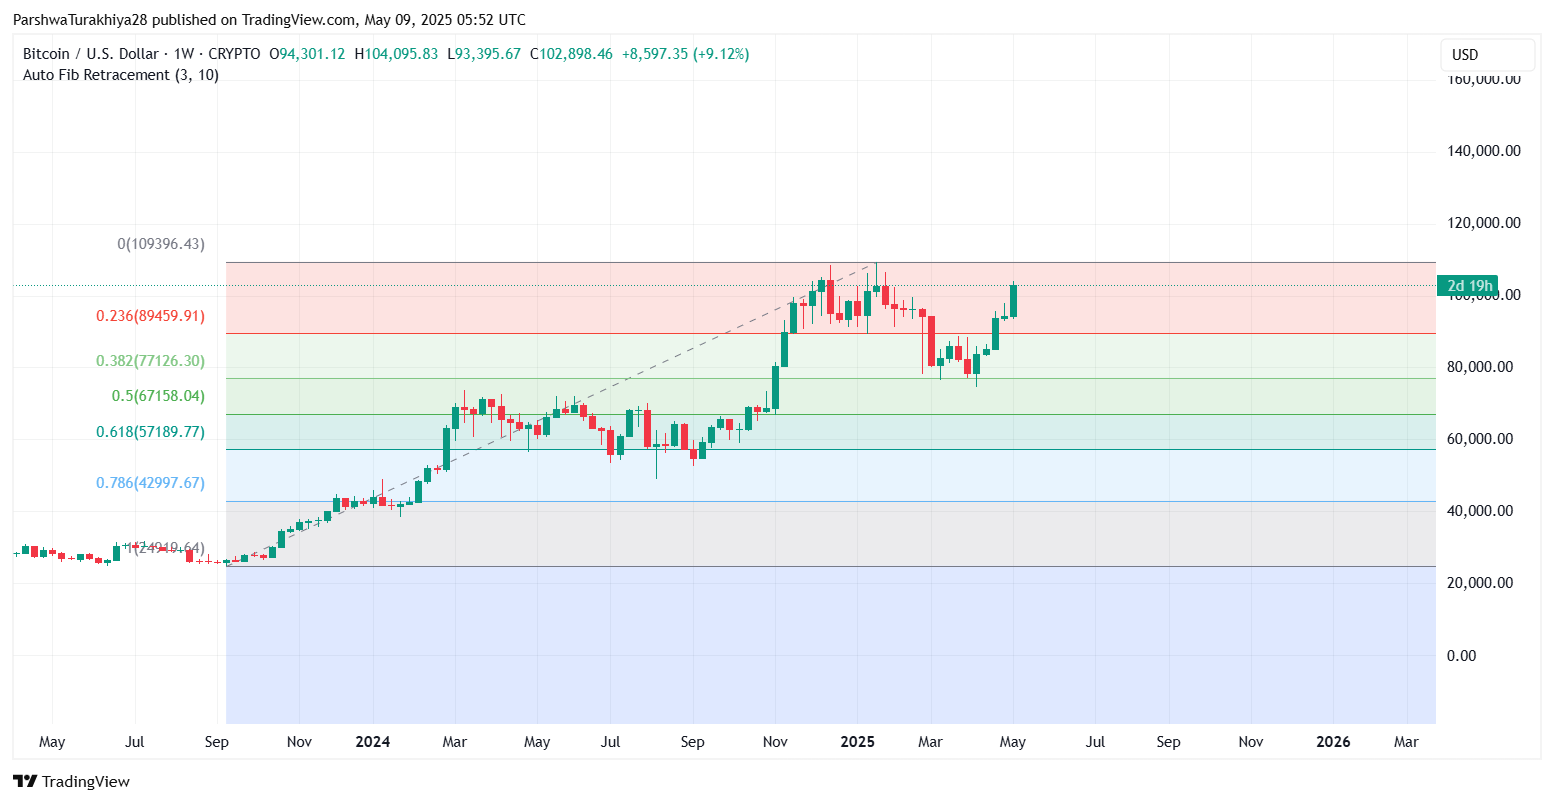
Bitcoin Price Chart (Source: TradingView)
In the daily time frame, Bitcoin price action has turned the March swing up high and is now trading above the 0.236 Fibonacci level ($89,459) weekly. This confirms breakouts from a wider range that lasted most of April. The four-hour chart reveals a series of higher lows and impulsive candle structures, indicating that there is strong underlying demand. It also surpassed the short-term downtrend line, reviving horizontal support for $97,500, further validating the breakout.
The weekly Fibonacci levels suggest a potential upward target for $109,396 if $103,700 is cleanly broken. However, the confluence of resistance can temporarily stall bullish momentum, especially as the short-term momentum indicators begin to cool down.
Why is Bitcoin price rising today?
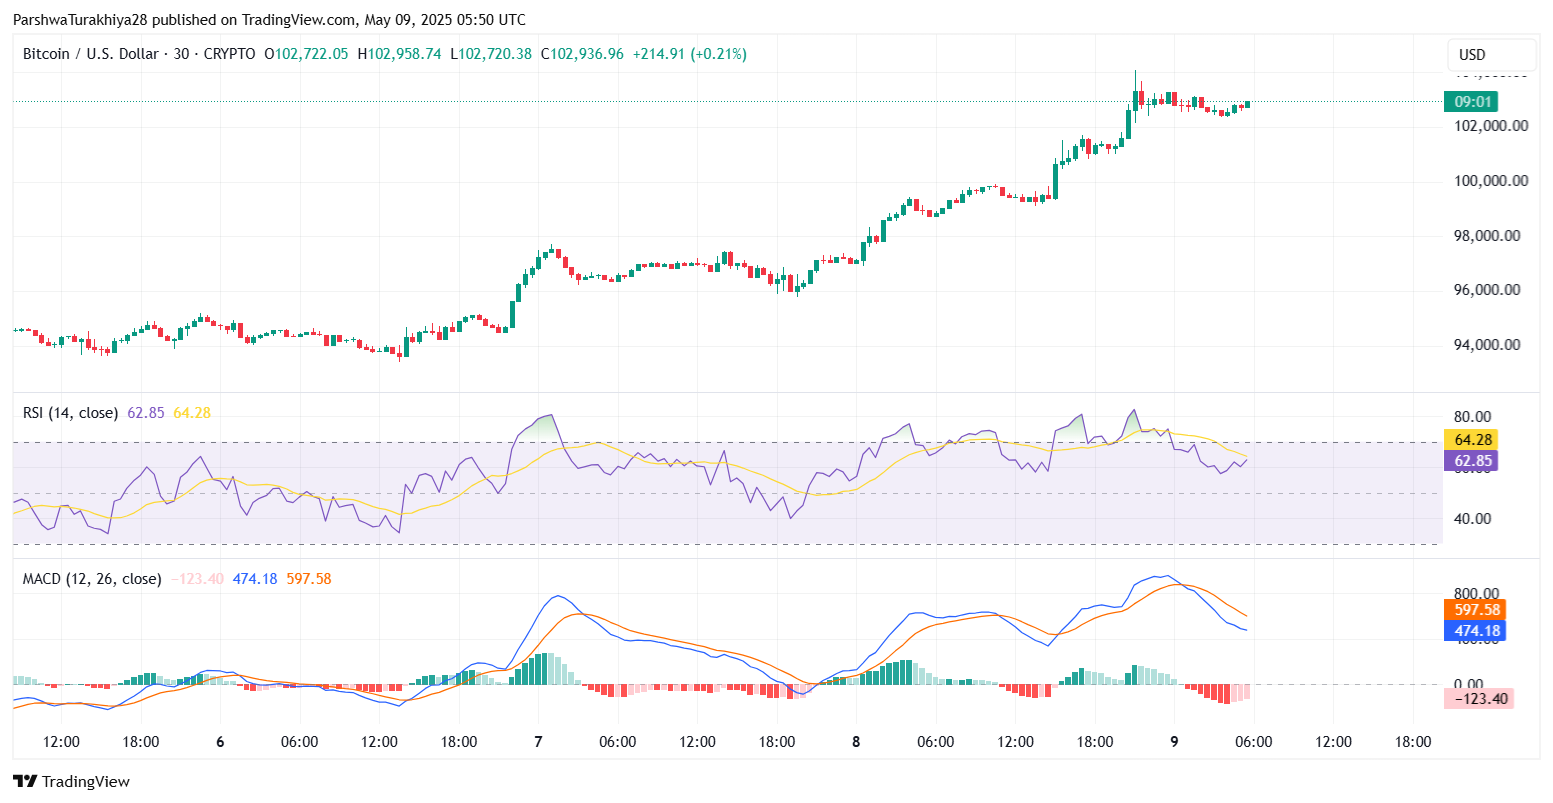
Bitcoin Price Chart (Source: TradingView)
On the four-hour chart, Bitcoin price volatility is expanding rapidly, with Bollinger bands expanding when they ride the top band, with prices close to $103,749. This reflects strong breakout behavior, but suggests short-term fatigue when prices are integrated under this upper limit.
In RSI (30 min), the index currently prints approximately 64.28 below from over-acquired measurements early in the session, suggesting a potential cooldown phase. MACD (30 min) on the other hand shows bullish bias, but the histogram begins to flatten as momentum slows.
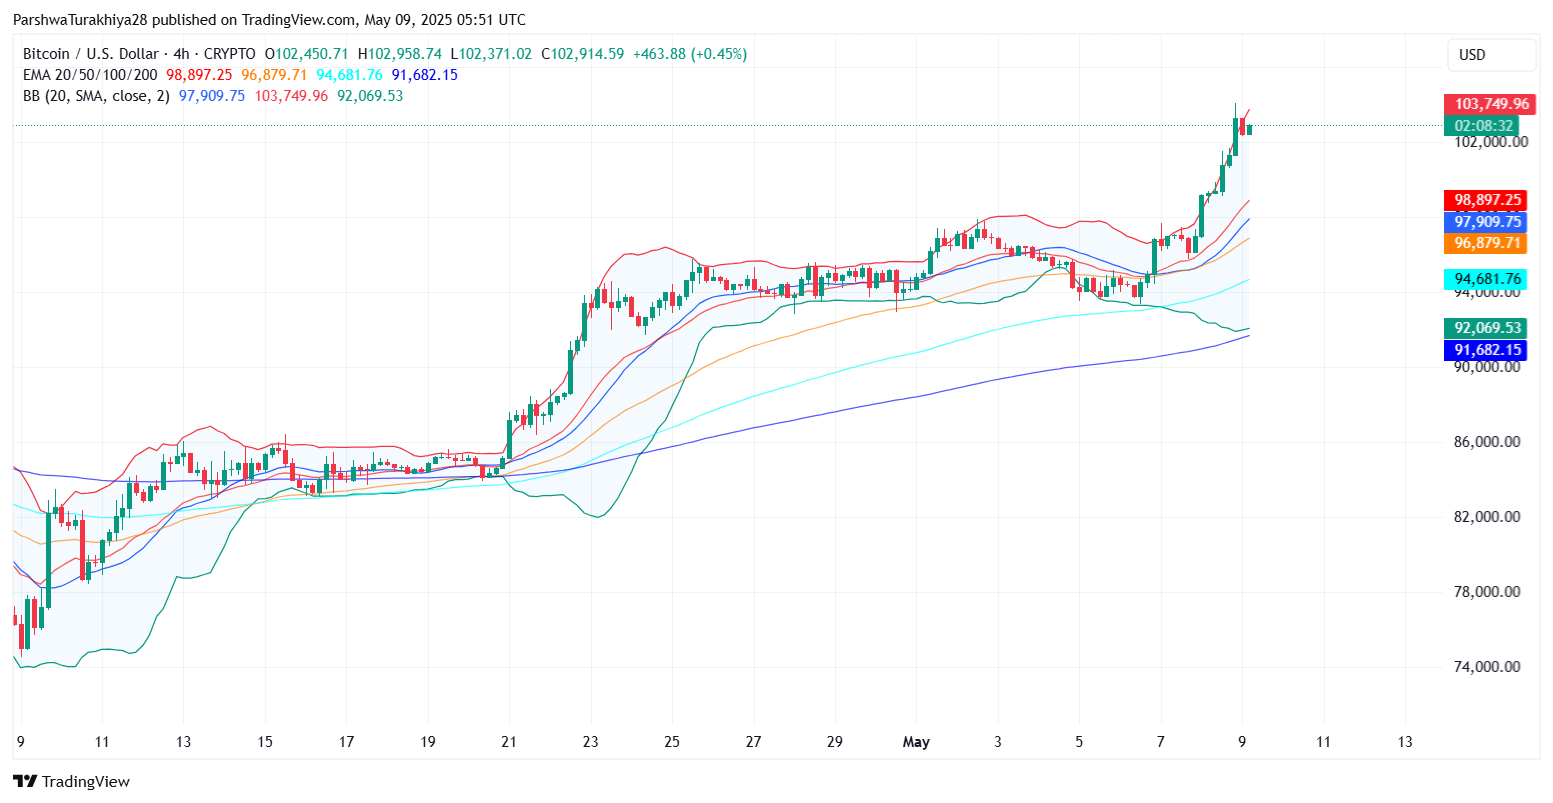
Bitcoin Price Chart (Source: TradingView)
From a moving average perspective, the four-hour EMA (20/50/100/200) stacks up on bullish alignment, with the 20-EMA close to $98,897 and the 50-EMA serving as dynamic support, close to $96,879. Bitcoin price updates show a sustained bullish structure, unless the $97,000 zone is violated by a sudden pullback.
The weekly Fibonacci retracement shows BTC trading well above the 0.382 and 0.5 zones, strengthening the bullish bias in the medium term. The decisive daily closure, over $103,700, paves the way for a goal of between $105,000 and $109,000 based on historic highs and FIB expansion zone.
May 10th BTC price forecast: Breakout extension or fake top?
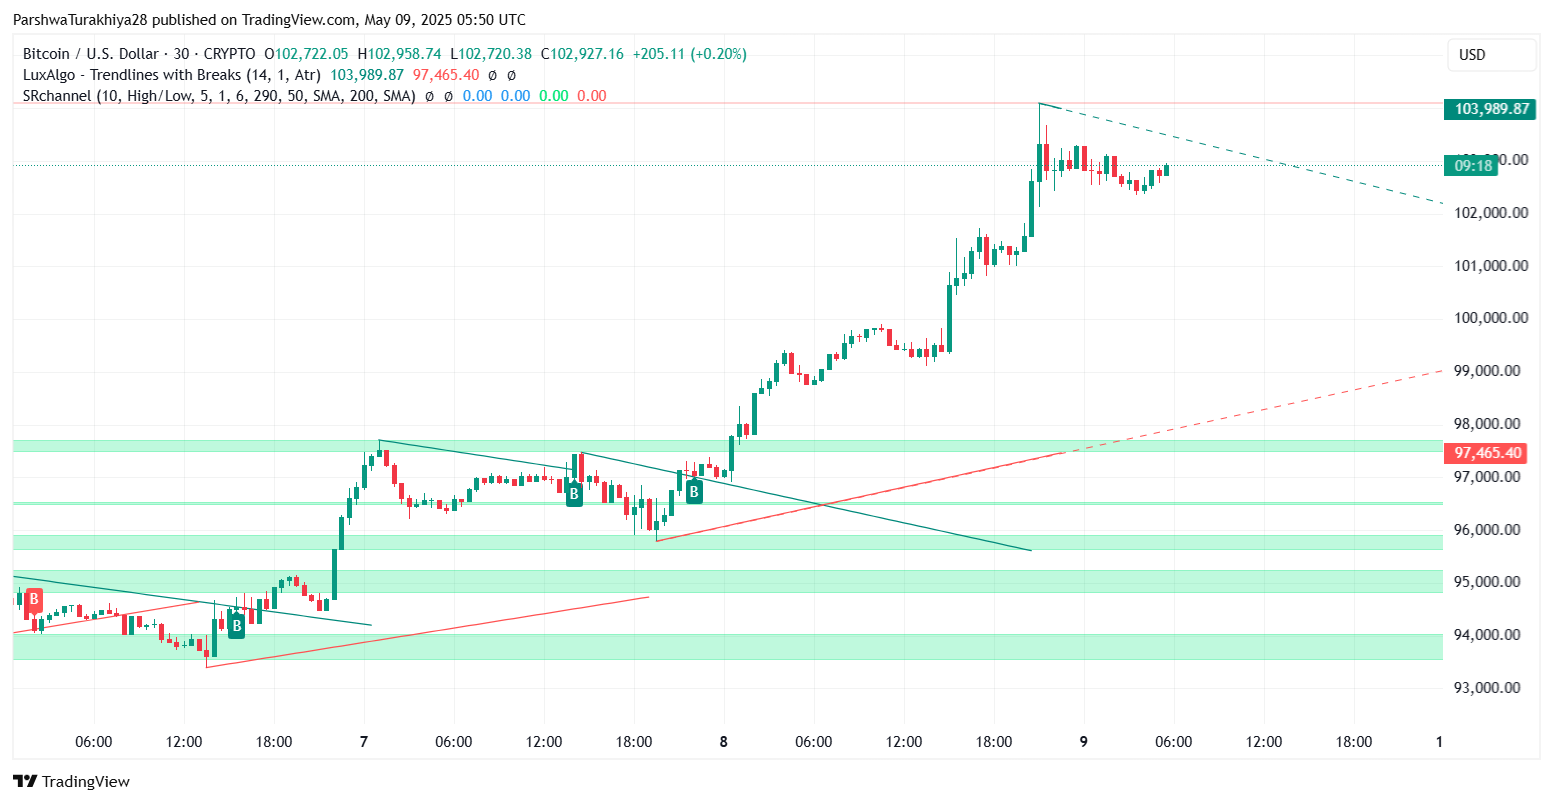
Bitcoin Price Chart (Source: TradingView)
Heading towards May 10th, Bitcoin’s price spikes have solid control over the Bulls, but unless the price clears $103,700 with a strong volume, the consolidation is likely. A clean breakout will trigger the next leg towards $105,000, but if you can’t exceed $101,800, you could end up with a short-term pullback at $97,500 or $96,000.
Traders should closely monitor short-term momentum cues for signs of fatigue. The broader trend remains bullish, but if buyers do not adhere to the $101,800-$102,000 region, local tops could be formed.
At the time of this Bitcoin price update, the momentum remains intact, but volatility is rising. The next 24 hours will be important to determine whether this breakout will maintain or retour.
Bitcoin (BTC) Prediction Table – Outlook on May 10th
Disclaimer: The information contained in this article is for information and educational purposes only. This article does not constitute any kind of financial advice or advice. Coin Edition is not liable for any losses that arise as a result of your use of the content, products or services mentioned. We encourage readers to take caution before taking any actions related to the company.