


Ethereum (ETH) has struggled to break through the $4,000 mark and regain a clear bullish structure, with price action tightening after several failed attempts to regain momentum. Markets remain cautious following the recent volatility, with traders closely monitoring whether ETH resumes its uptrend or continues its decline. Analysts are currently divided, with some arguing that Ethereum’s fundamentals remain strong due to network activity, progress in scaling, and institutional traction, while others point out that increasing downside pressure and weakening market structure could lead to further declines.
Despite price uncertainty, fresh on-chain data shows growing confidence among long-term participants. More than 200,000 ETH (worth about $780 million) was withdrawn from exchanges in the past 48 hours, according to Santiment, one of the largest short-term outflow spikes this quarter. Such activity typically suggests accumulation, as investors move assets into self-custody rather than storing them on an exchange for sale.
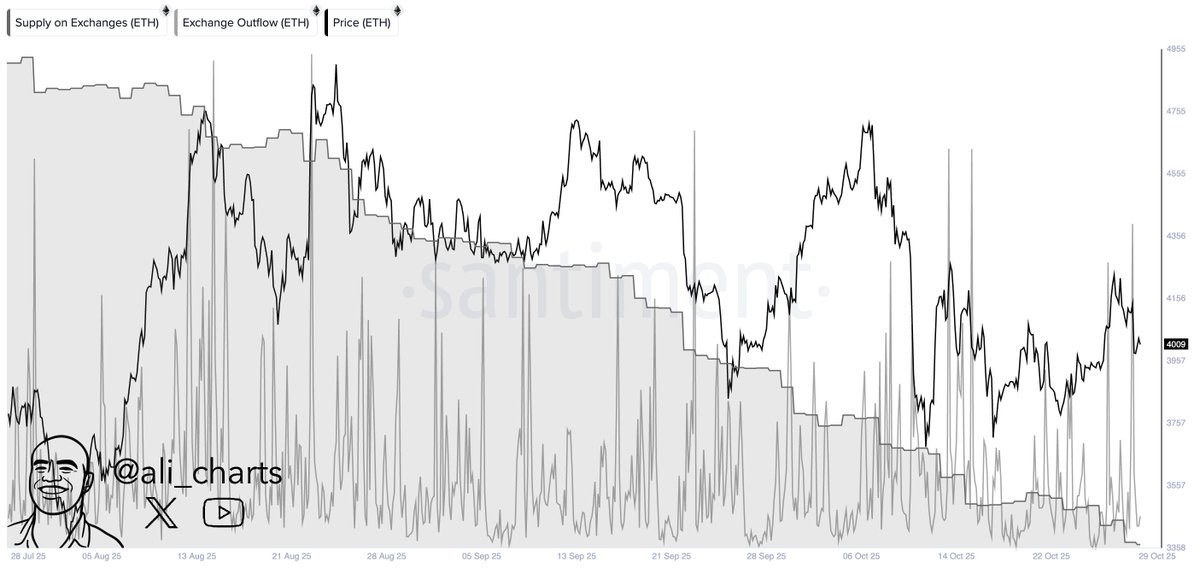
This disconnect between price hesitancy and mass accumulation reinforces the current market debate. Ethereum is at a pivotal moment as liquidity dynamics change, and whether it can recover $4,000 will likely determine whether bullish momentum re-emerges heading into November.
Large ETH withdrawals signal investor confidence as market moves towards risk-on environment
The recent wave of large Ethereum withdrawals from exchanges further reinforces the market’s growth theme of increasing investor confidence. With over 200,000 ETH in self-custody within 48 hours, many participants appear confident in Ethereum’s medium-term prospects, suggesting accumulation rather than distribution. Historically, significant currency outflows have coincided with an accumulation phase that precedes a major market advance, especially when combined with favorable macro shifts.
For many analysts, Ethereum is currently at the center of a potential bullish impulse across altcoins. Overall market sentiment remains positive, despite the recent struggle to convincingly regain the $4,000 level. ETH continues to benefit from fundamental tailwinds, including increased network utility, growing Layer 2 activity, and an increase in staking participants. Ethereum’s role as the altcoin ecosystem’s primary payments and liquidity hub positions it to lead capital flows should market conditions become decisively risk-on.
The macro situation is also aligned in favor of ETH. Global liquidity is expected to gradually improve after the Federal Reserve cut interest rates by 25 basis points and signaled an end to quantitative tightening. Historically, shifts toward monetary easing have accelerated flows into risk assets, including cryptocurrencies. As traditional markets anticipate a clearer reversal, investors may increasingly seek exposure to high-beta assets with strong structural narratives, and Ethereum fits that profile.
Ethereum holds $3,900 as price dips below major moving averages
Ethereum (ETH) is trading near $3,905, holding an important support area, but struggling to regain upward momentum as the price remains below key moving averages. After failing to sustain a move above the $4,200 resistance area earlier this month, ETH has fallen into a tightening range, reflecting indecision and reduced volatility following recent macro-driven moves.
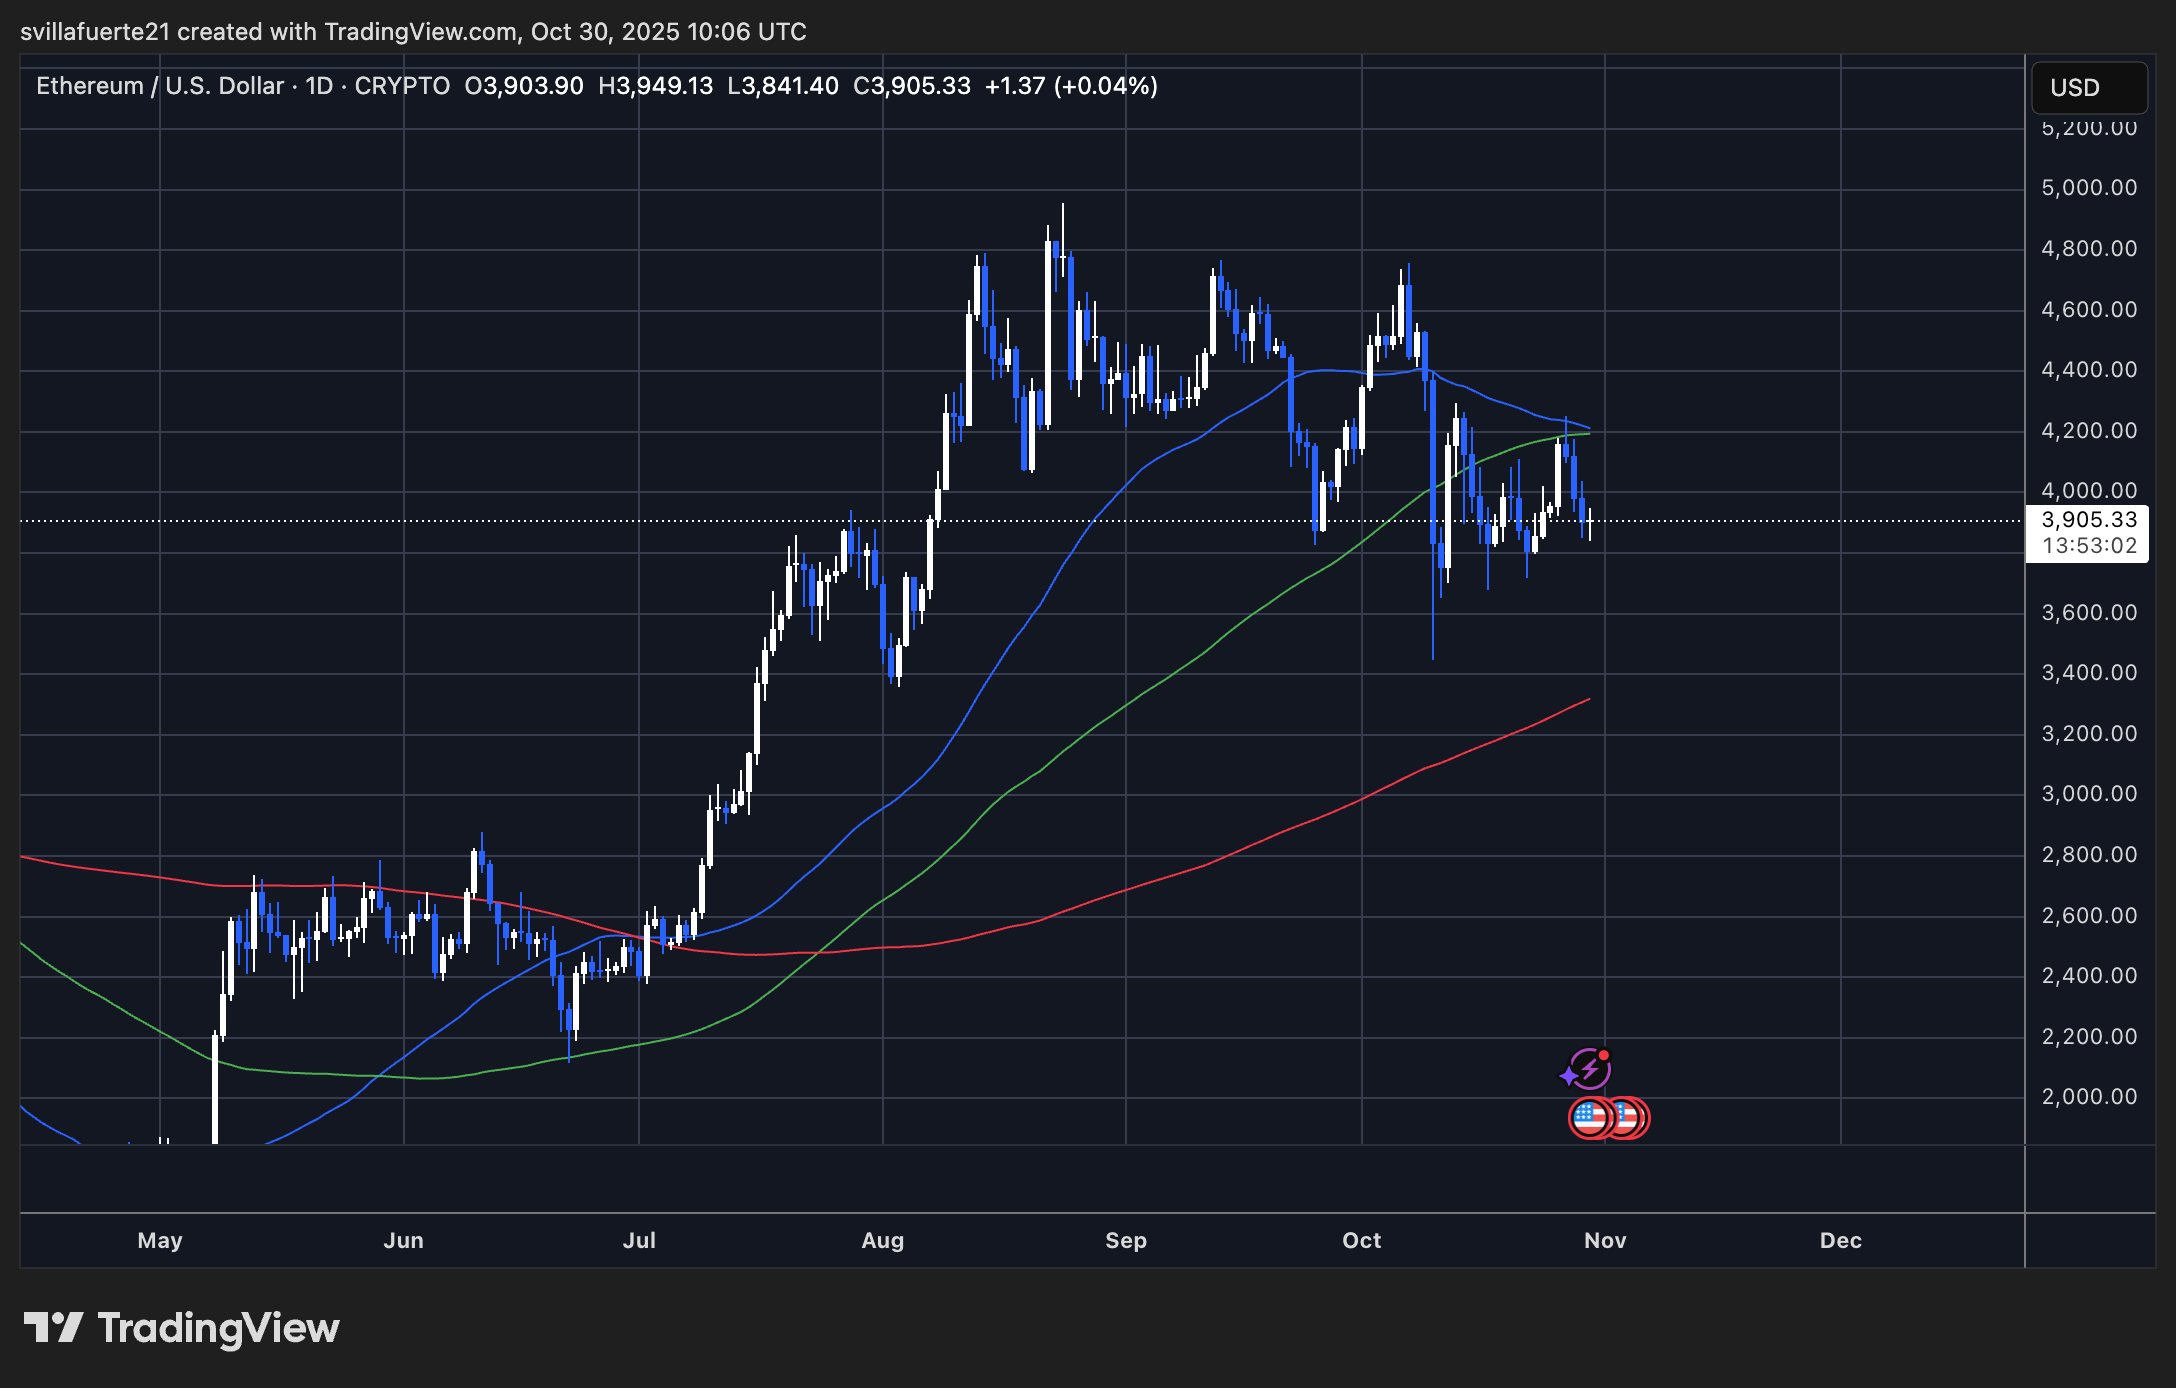
The chart shows that ETH is trading below both its 50-day moving average (blue) and 100-day moving average (green). These moving averages are currently just above the price and are acting as dynamic resistance. For bulls, a return to these levels, especially above $4,050-$4,150 close, would be a constructive sign that momentum is shifting back in favor of buyers. Such a recovery could pave the way for a retest of the $4,300-$4,500 level, where supply pressure has been consistent lately.
On the downside, the $3,800 level remains the major support to watch. A sustained break below this zone could expose ETH to low levels near $3,500, especially if broader market sentiment weakens. However, the 200-day moving average (red) is still well below the price near $3,200, indicating that the long-term bullish structure is still intact.
Featured image from ChatGPT, chart from TradingView.com