


Ethereum price is slightly red today, down about 1.8% to around $3,013, while Bitcoin remains barely green. Poor performance is not new. Ethereum also fell nearly 23% this month, also falling more than Bitcoin.
There is a new reversal attempt on the chart, but this setup has already failed once. Unless one key level eventually breaks, it will probably fail again.
RSI shows clear bullish divergence, but history shows failure is still possible
A clean bullish divergence was formed between November 4th and November 19th. Prices hit lower lows, but the RSI, a momentum indicator that measures whether price movements are strong or weak, hit higher lows. Since RSI turns faster than price, such divergences often appear before a trend reversal.
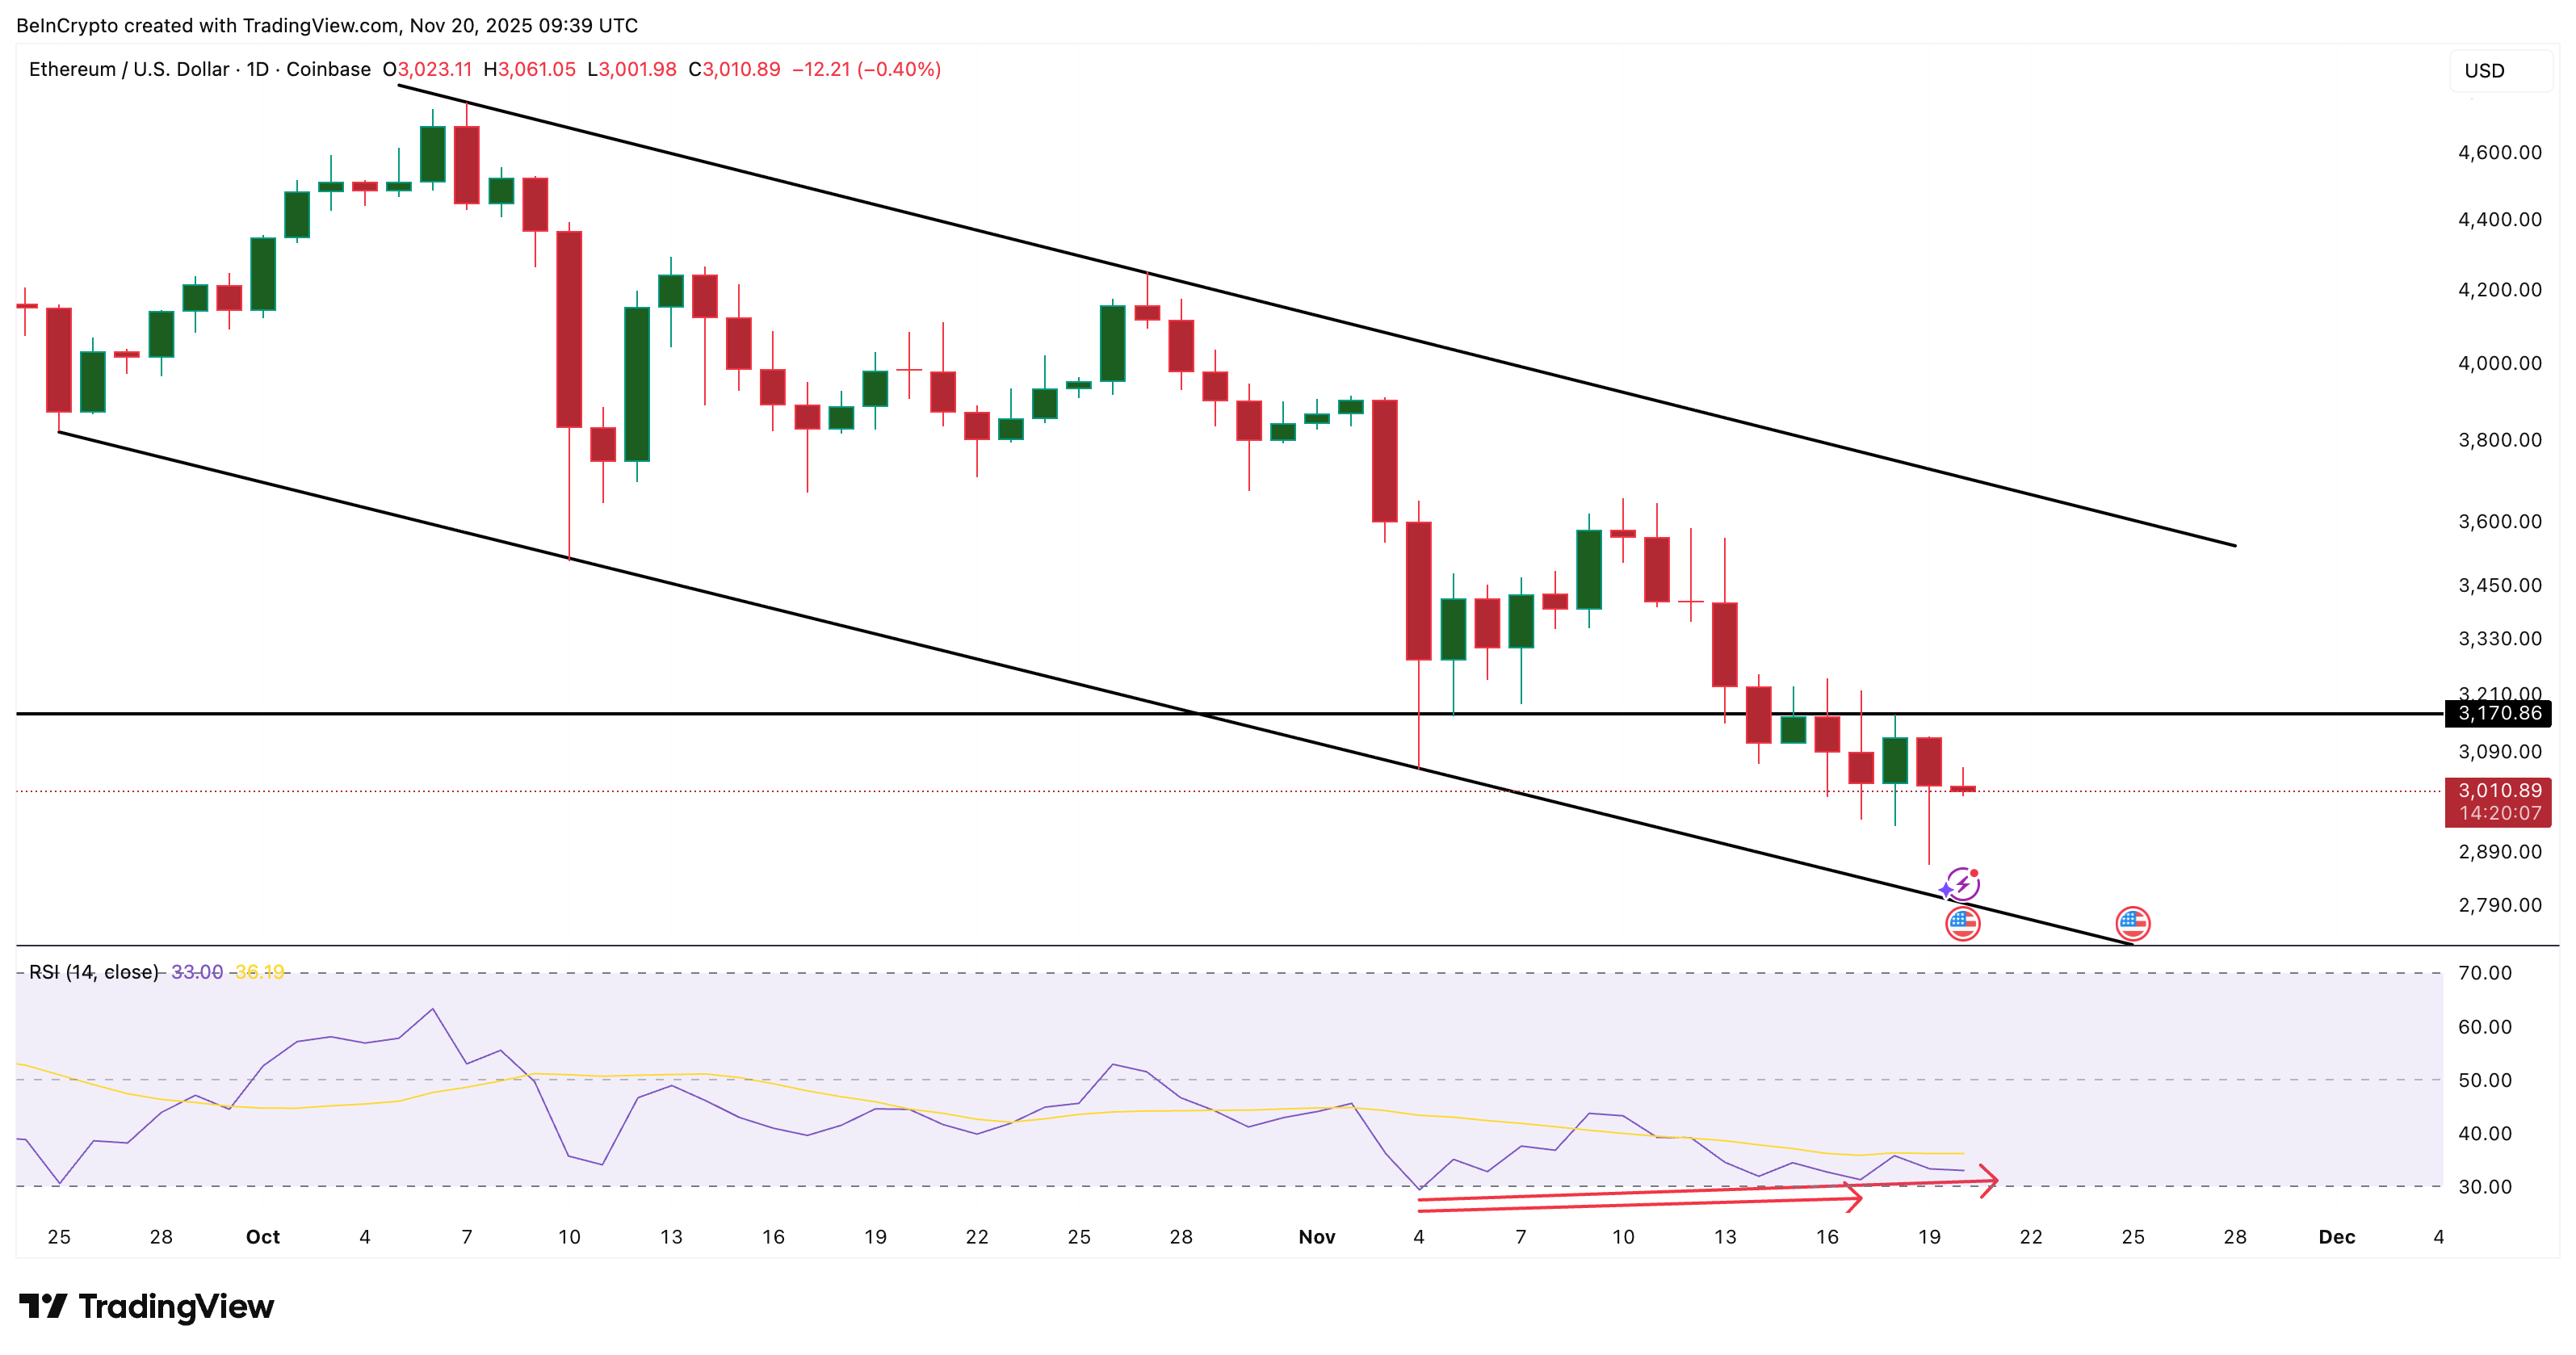
Ethereum flashes reversal sign: TradingView
Want more token insights like this? Sign up for Editor Harsh Notariya’s Daily Crypto Newsletter here.
However, Ethereum previously showed the same signal from November 4th to November 17th, but it still failed. Both reversal attempts hit the same $3,170 wall. The chart is flashing the correct signals, but the structure behind it is not yet supported.
Reversals keep failing: selling pressure and large supply clusters?
Long-term holders are not supporting the pullback. Hodler net position change, which tracks investor wallet flows, remains negative. On November 18th, long-term holders were already in a net negative position of 524,819 ETH, but that number expanded to 583,171 ETH on November 19th.
This means that an additional 58,352 ETH (approximately $175 million at current prices) was under selling pressure within 24 hours. Until this changes, RSI-based reversals will remain vulnerable.
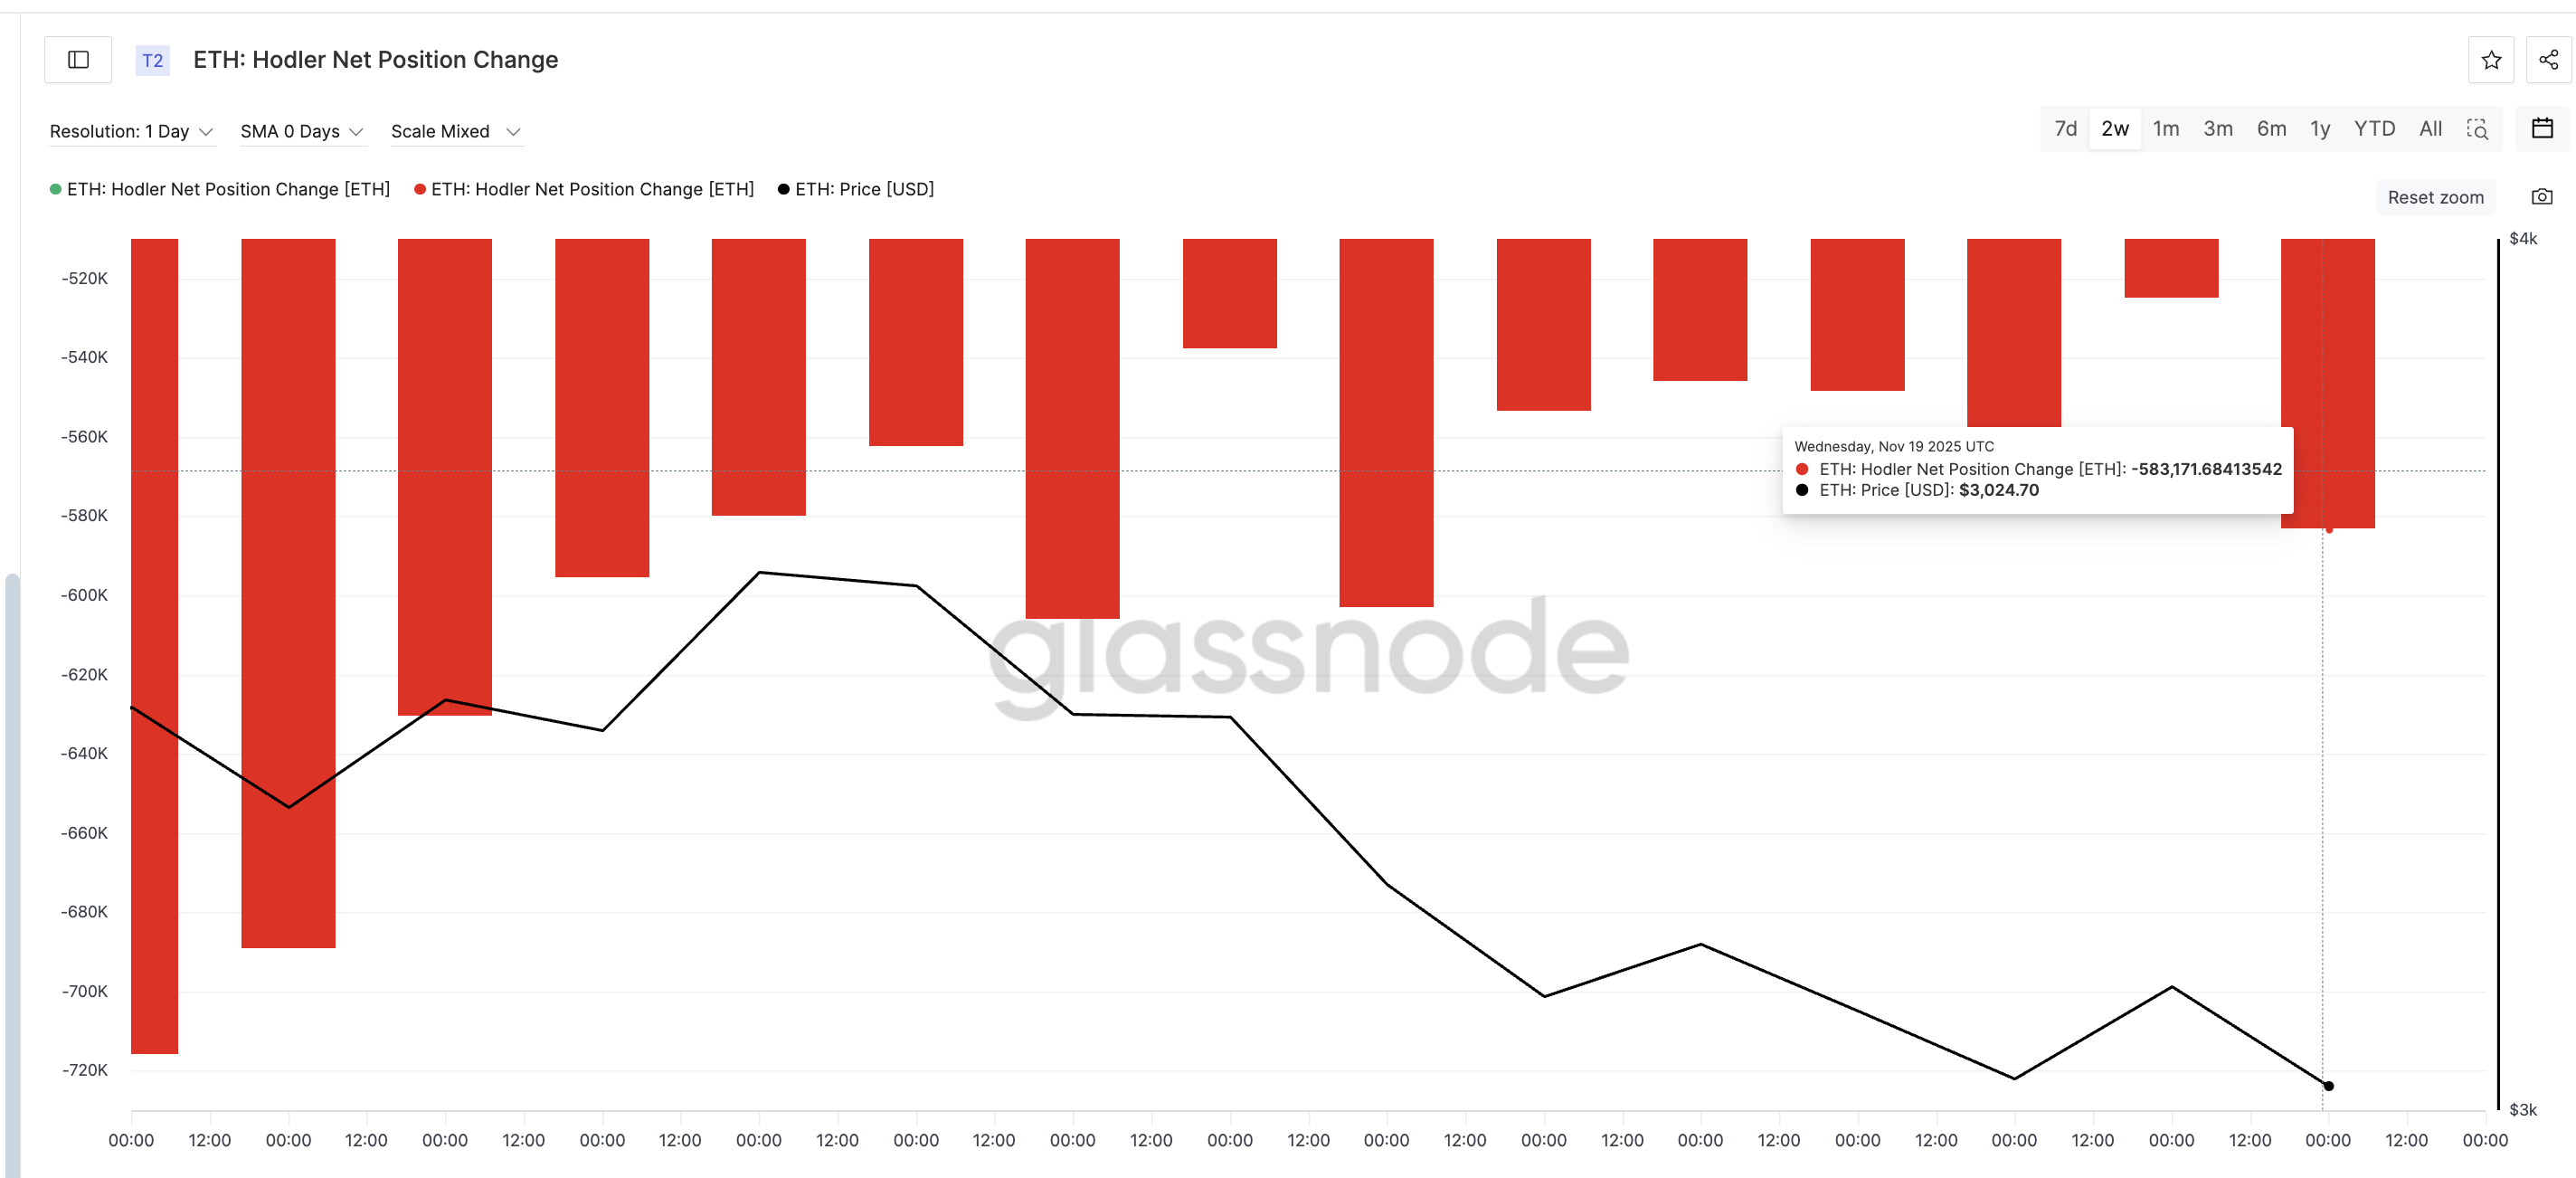
HODLers continue to sell ETH: Glassnode
The rest is explained by a cost-based heatmap, an indicator that shows major supply clusters. The strongest supply block in recent months has been between $3,150 and $3,170, holding approximately 2.69 million ETH. This zone is highlighted in orange on the heatmap and rejects any attempts to move higher. This is also the zone where a previous divergence attempt failed on November 17th.
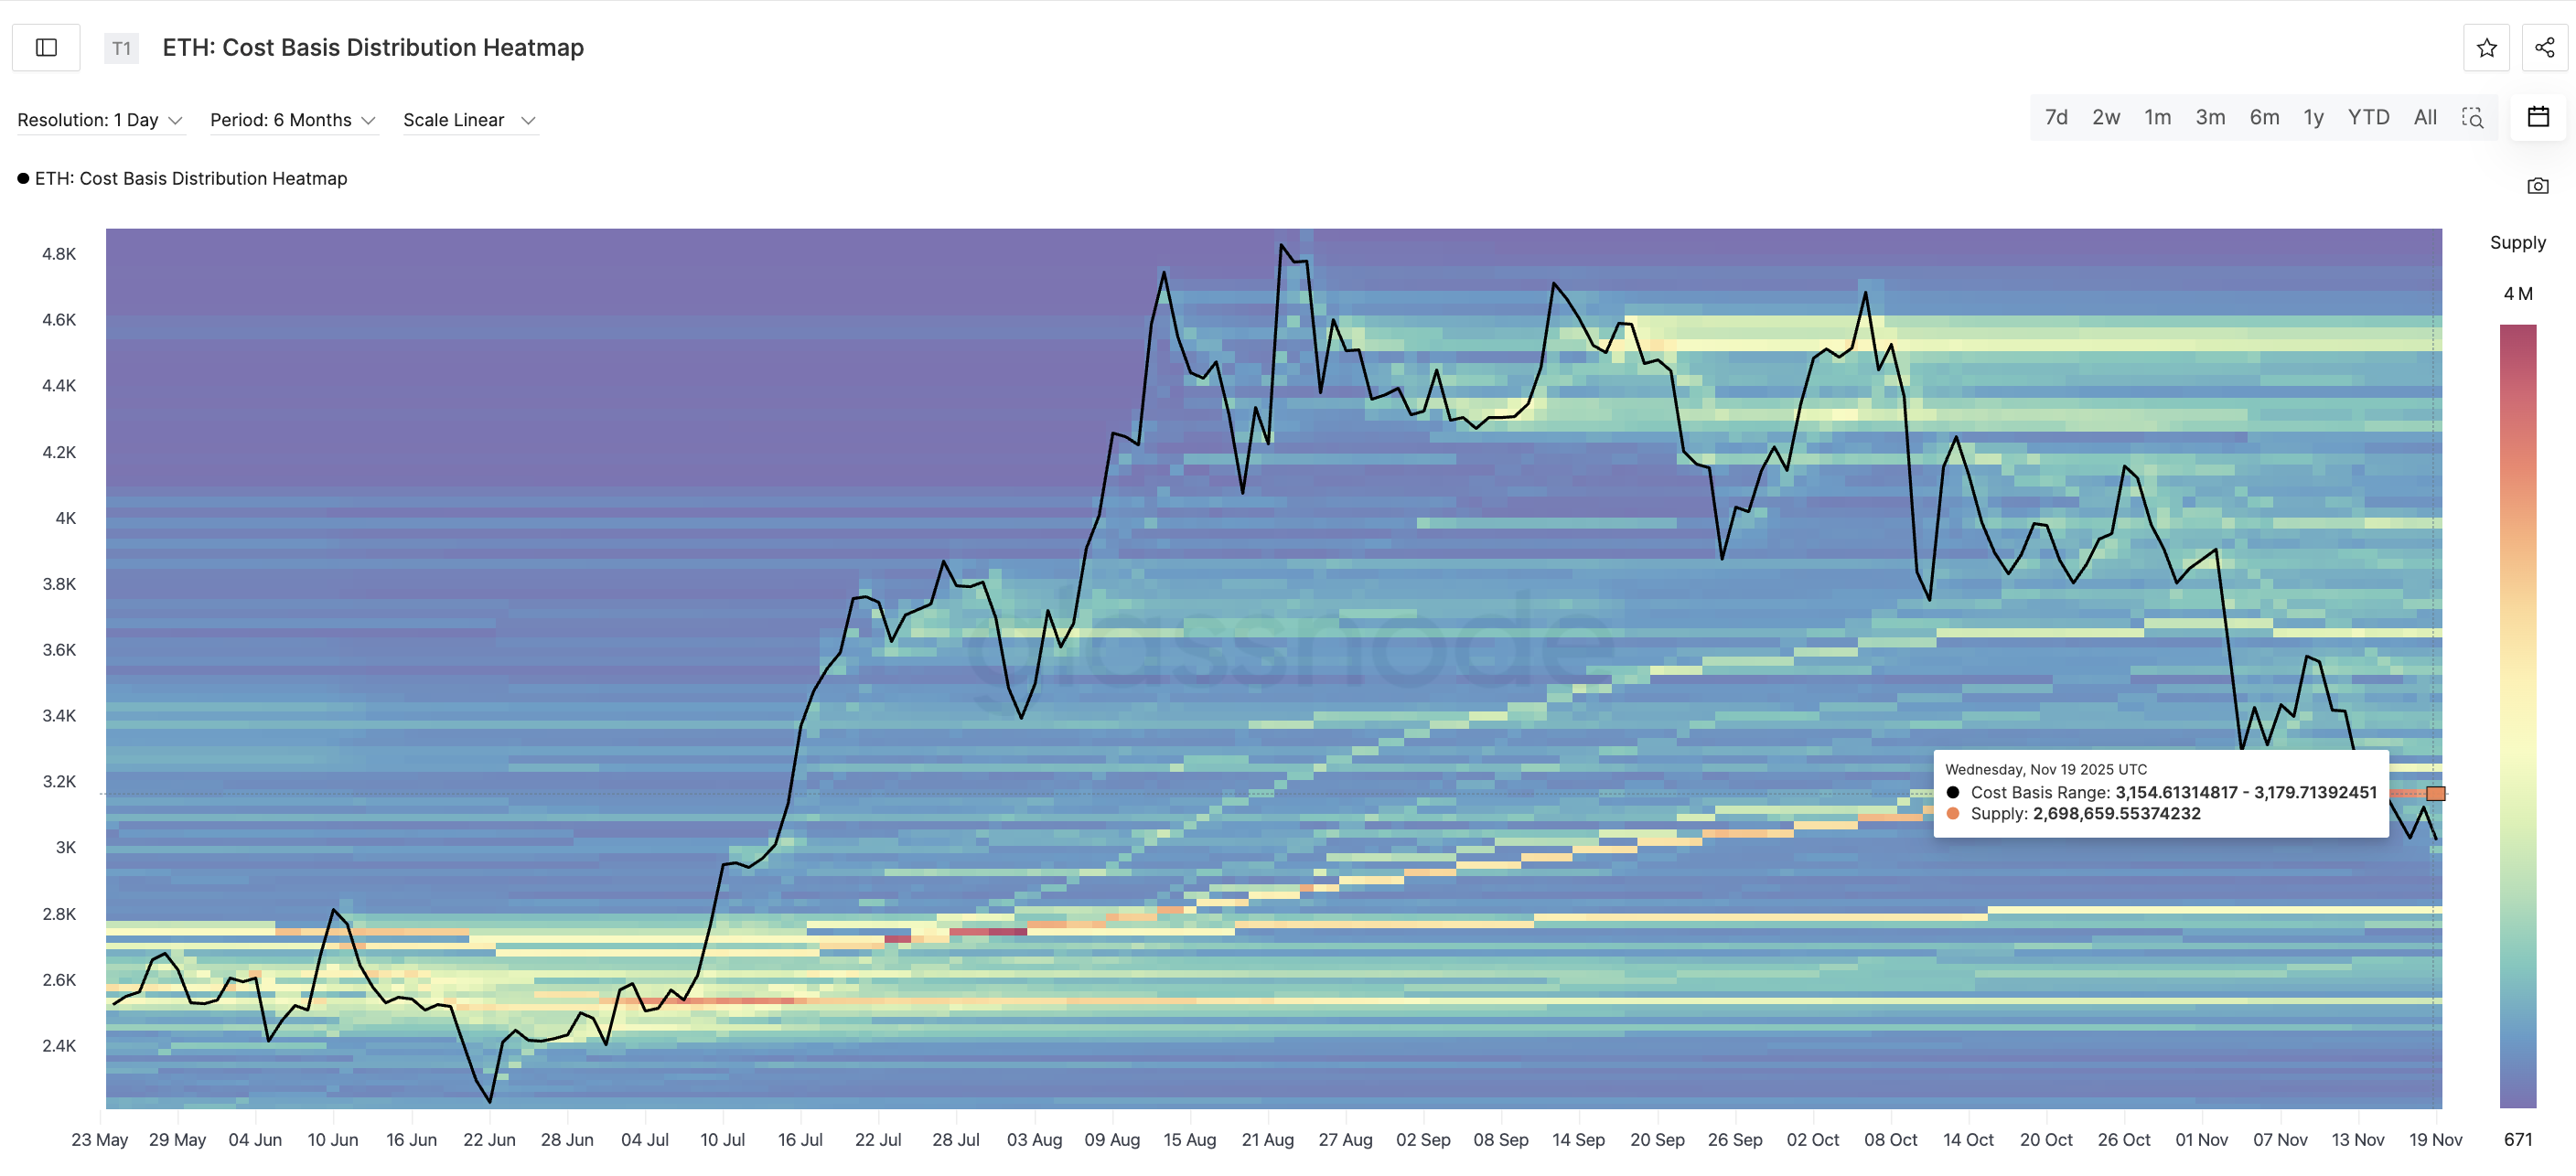
The strongest ETH supply cluster: Glassnode
Ethereum price reversal setups continue to be crushed before they can develop as long-term holders sell and there is a heavy supply wall outweighing the price.
Ethereum price stays in descending channel until breaking $3,170
Ethereum price continues to trade within a descending channel. The 0.382 Fibonacci level at $3,170 is perfectly aligned with the same resistance cluster. This means that $3,170 is not just a chart level, but a structural linchpin of the entire trend.
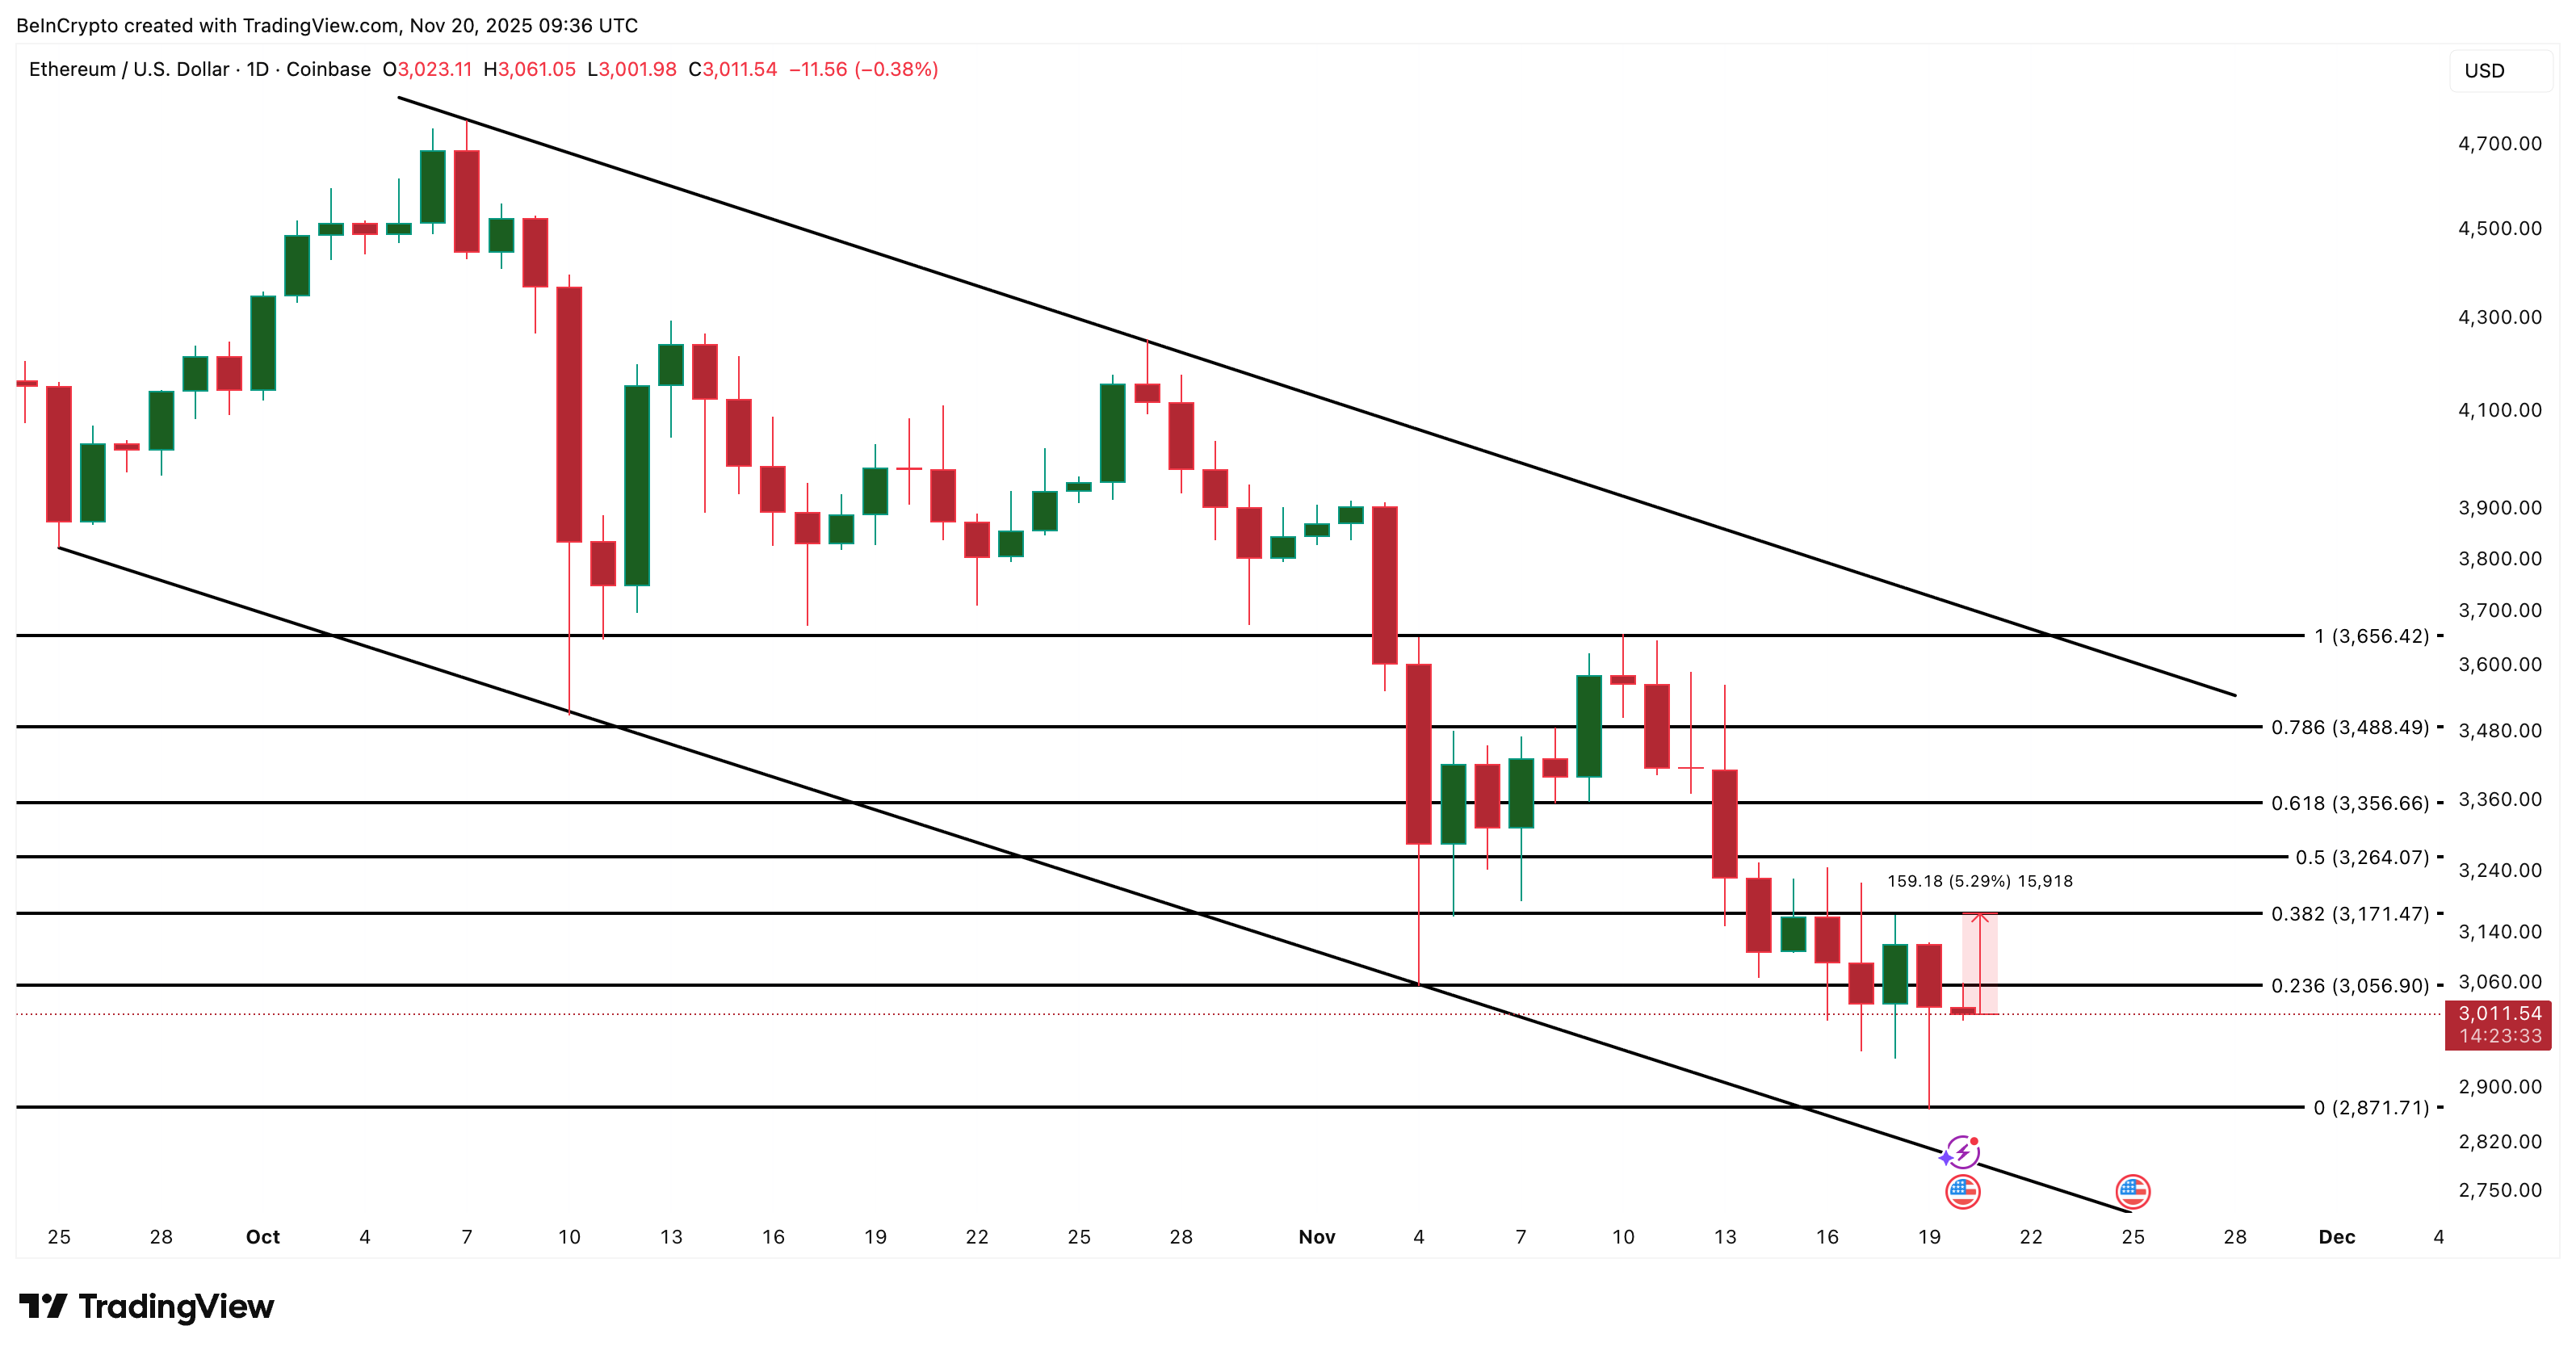
Ethereum Price Analysis: TradingView
Unless Ethereum closes above $3,170 each day, any pullback will remain temporary and the trend will remain bearish.
If a breakout eventually occurs, the next target would be $3,656, the upper Fibonacci zone where momentum could be reset. Until then, price is vulnerable to further sharp declines in the lower range of the channel. Also, failure to break above $3,170 and hold $3,056 could push Ethereum price to the bottom of the channel.
The post $3,170 ceiling? The post Why Ethereum Price Rise Continues to Fail appeared first on BeInCrypto.